

Who is the biggest buyer in the stock market right now?
Corporations are—and their buybacks have meaningfully changed how prices move.
When firms retire shares they cut supply, act as a steady buyer, and boost EPS, so prices can rise even without better sales or margins.
This piece shows how those supply-and-demand mechanics, announcement signals, and execution choices make buybacks a major driver of returns and volatility, and what levels and data to watch if you want to trade or defend a portfolio.
Core Mechanics of Buybacks and Their Direct Influence on Stock Price Behavior
When a company executes a share repurchase program, it pulls equity from circulation, shrinking the number of shares available to trade. This reduction in float lowers supply in the market while the company itself becomes a persistent buyer, creating immediate demand pressure even when fundamental earnings stay unchanged. Think of it as pulling chairs from a game of musical chairs. Fewer seats mean each remaining seat becomes more valuable, and that scarcity alone lifts the price per share. The direct influence works through three channels: the company absorbs existing seller pressure, float reduction tightens liquidity, and the act of buying signals committed institutional demand that independent investors can’t easily replicate.
The empirical evidence confirms this mechanism operates at scale. Since 2000, corporate buybacks have accounted for +$5.5 trillion of net equity flows, while pensions and mutual funds were net sellers at –$2.7 trillion, making corporations the single largest source of demand in the U.S. equity market over that period. The short-term correlation between four-week changes in buyback activity and S&P 500 movement runs at approximately 0.85, demonstrating that fluctuations in repurchase intensity drive index-level price moves almost in lockstep. Over the past decade, corporate buybacks contributed 27% of total S&P 500 returns, peaking at 40.5% during the most intense repurchase phases. Without that corporate bid, the equity market would be roughly 30% lower today.
Price reactions often begin at announcement rather than execution. When a board authorizes a new buyback program, the stock typically jumps on the signal of confidence and the promise of future demand, even though actual purchases may unfold slowly or not at all. Completion rates vary widely. Many authorizations are renewed annually without full use. But the announcement effect reflects the market’s expectation that a credible buyer will step in if the stock weakens. This dynamic can prop up prices during earnings disappointments or sector rotations, stabilizing downside volatility in ways that passive fund flows cannot.
Main mechanisms that immediately move stock prices:
- Float reduction shrinks tradable supply, raising the marginal clearing price for the same level of outside demand.
- Corporate demand acts as a recurring, non-price-sensitive buyer that absorbs selling pressure during periods of institutional rotation or retail liquidation.
- EPS accretion from lower share counts lifts reported earnings per share, attracting momentum and quantitative strategies that screen on earnings growth.
- Announcement signal conveys management belief that shares are undervalued, pulling forward investor repositioning before actual purchases begin.
- Liquidity withdrawal tightens bid-ask spreads and amplifies volatility during low-volume sessions, making intraday price moves larger on the same order flow.
Supply Reduction, EPS Accretion, and Valuation Changes from Corporate Buybacks
Reducing the denominator in the earnings-per-share calculation is pure arithmetic: if net income stays flat and the share count falls, EPS rises proportionally. A company with $1 billion in earnings and 100 million shares reports $10.00 per share. Retire 10 million shares and the same $1 billion yields $11.11 per share. An 11% EPS gain with zero operational improvement. This mechanical lift makes it easier for management to meet or beat quarterly EPS targets and drives headline growth rates that analysts and momentum investors track closely. Because changes in earnings growth predict forward returns empirically, buyback-driven EPS gains influence market expectations and can expand valuation multiples even when revenue and margin trends are stagnant.
When EPS climbs faster than the stock price, the price-to-earnings ratio compresses, signaling relative “cheapness” to value screens and quantitative models. That compression can attract a new wave of buyers: value funds, dividend-growth strategies, and algorithmic screens who interpret the lower P/E as improving fundamentals rather than financial engineering. The feedback loop can sustain price appreciation well beyond the initial buyback announcement, especially if the company layers additional authorizations or beats lowered EPS estimates quarter after quarter. Shareholder value appears to grow because per-share claims on assets and future cash flows become larger, even if the enterprise’s aggregate profitability is flat or declining.
The risk lies in mistaking EPS optics for real economic progress. A firm buying back shares while revenue growth stalls or margins contract is redistributing the same, or shrinking, pie into fewer slices. Not baking a bigger pie. Apple’s $110 billion authorization in 2024 drew scrutiny because five-year annualized revenue growth had been flat since 2018, raising questions about whether capital was being deployed to mask stagnation rather than fund innovation or capacity expansion. Investors who focus solely on EPS trends without inspecting total net income, revenue growth, or return on invested capital can overpay for companies engineering short-term metrics at the expense of long-term competitive position.
| Scenario | Net Income | Shares Outstanding | EPS |
|---|---|---|---|
| Before Buyback | $1,000M | 100M | $10.00 |
| After 10% Buyback | $1,000M | 90M | $11.11 |
| Revenue Decline Case | $950M | 90M | $10.56 |
| Growth Case | $1,100M | 90M | $12.22 |
Methods of Executing Buybacks and Their Different Pricing Effects
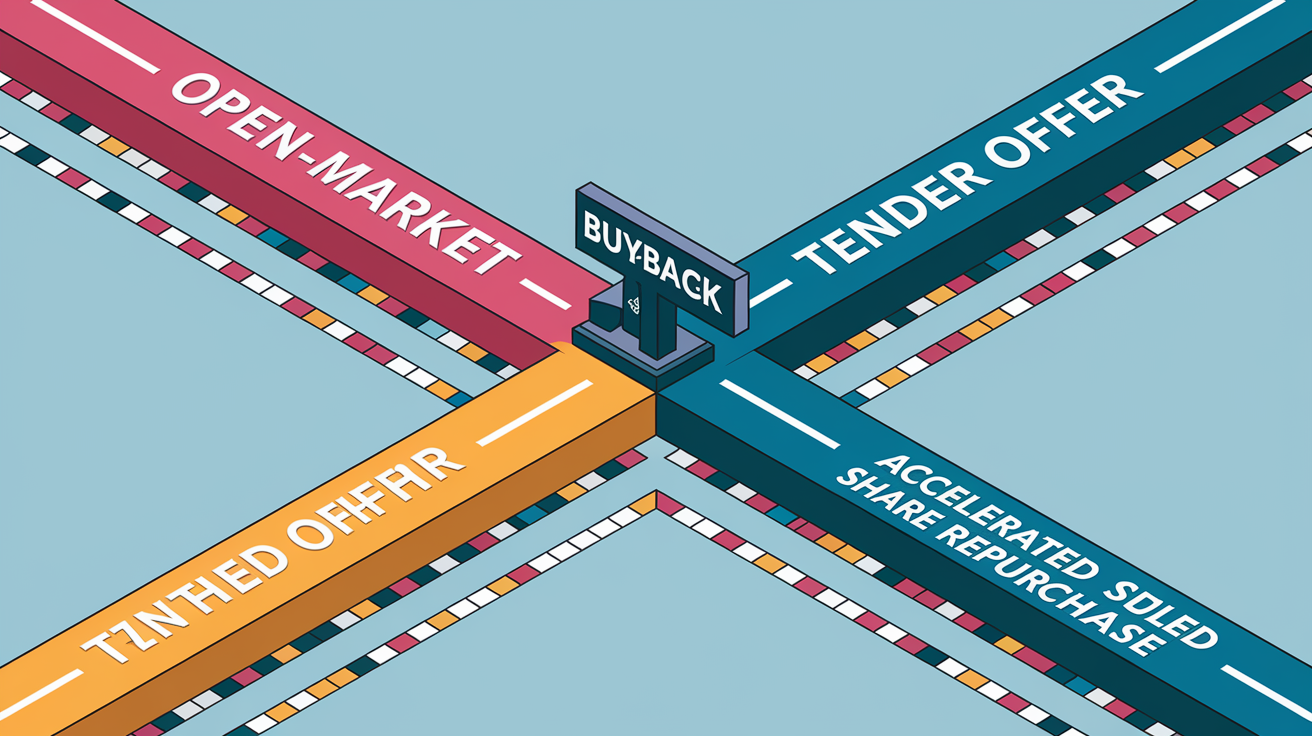
The method a company chooses to repurchase shares determines how quickly price moves, how much liquidity changes, and which shareholders benefit. Open-market repurchases spread purchases across many trading sessions under regulatory safe harbors, tender offers invite shareholders to sell at a premium in a short window, and accelerated share repurchases front-load the float reduction by having an investment bank deliver shares immediately. Each approach shifts supply and demand curves on different time horizons and with different volatility signatures.
Open-Market Repurchases
Open-market repurchases follow Rule 10b-18 constraints: a company may buy up to 25% of average daily volume, must avoid opening and closing auctions in most cases, and can’t exceed the highest independent bid or last sale price. These rules spread buyback activity across weeks or months, creating steady but incremental demand that props the stock during selloffs without triggering abrupt spikes. The predictable bid can compress bid-ask spreads during normal sessions but may widen spreads during volatile periods when the company stays on the sideline. Because execution is discretionary, management can pause buybacks when cash is tight or the stock rallies beyond target valuations. The support is conditional rather than guaranteed. Open-market programs offer a floor, not a trampoline.
Tender Offers and Dutch Auctions
A tender offer invites shareholders to sell a fixed number of shares at a specified premium to the current market price, typically 10 to 20% above the prevailing quote. The premium immediately lifts the stock toward the tender price, and arbitrageurs who expect the offer to close will buy shares in the open market and tender them for the spread. Dutch auctions let shareholders name their price within a range. The company then sets a clearing price that fills the target quantity at the lowest cost. Both methods concentrate price impact into days rather than months, create temporary upward pressure, and can signal strong confidence. But they also force the company to pay above market and can leave the stock vulnerable to a post-close dip once the premium evaporates.
Accelerated Share Repurchases
An ASR involves the company paying an investment bank upfront in exchange for immediate delivery of a large block of shares, which the bank borrows and buys back over subsequent weeks. The float reduction happens on day one, compressing the share count and lifting EPS in the current quarter even though the bank’s hedge-buying unfolds over time. Intraday volatility often spikes as the bank accumulates inventory, and the final settlement can trigger an additional price adjustment if the volume-weighted average price during the repurchase period differs from the initial estimate. ASRs are popular when management wants to lock in a specific EPS benefit before quarterly earnings or when the stock has sold off sharply and the board wants to signal decisive action. Front-load the float cut, back-load the market risk.
Regulatory Constraints, Safe Harbors, and Manipulation Concerns in Buyback Activity

Before 1982, the Securities and Exchange Commission treated corporate share repurchases as a form of illegal price manipulation, on the theory that a company buying its own stock distorts supply and demand to benefit insiders. Rule 10b-18, adopted that year, created a regulatory safe harbor: firms that adhere to volume limits (25% of average daily trading volume), timing restrictions (no opening or closing trades in most cases), price ceilings (no purchases above the highest independent bid or last sale), and single-broker consolidation can presume their buybacks won’t be prosecuted as manipulative. The rule effectively legalized buybacks by defining conditions under which the SEC would not challenge repurchase activity, acknowledging that corporate buying does influence prices but permitting it within guardrails.
Blackout periods further constrain timing. Most companies suspend repurchases during the weeks leading up to quarterly earnings announcements to avoid allegations of trading on material nonpublic information, meaning the corporate bid disappears precisely when uncertainty and volatility peak. This self-imposed quiet period can amplify price swings. If bad news leaks or guidance is cut, the stock falls without the buyback cushion. If results beat, the stock rallies without the company capturing shares at depressed levels. The blackout dynamic creates predictable windows of lower liquidity and higher volatility that options traders and short-sellers exploit.
Incentives tied to stock-based compensation distort buyback timing in ways regulation doesn’t address. Because executive bonuses and equity grants vest based on stock price or EPS targets, managers have personal financial reasons to authorize buybacks that lift short-term metrics even if long-run value creation would favor reinvestment in R&D, capacity, or acquisitions. A Wall Street Journal survey found that 93% of CFOs acknowledged outside pressure to influence stock price or manipulate earnings figures, illustrating how buyback decisions can serve agency interests rather than shareholder welfare. The safe harbor protects companies from manipulation charges but doesn’t prevent economically inefficient repurchases executed to hit compensation hurdles or prop stock prices during option-vesting periods.
Market Impact Evidence: Flows, Correlations, and Historical Trends in Stock Buybacks

Aggregate flow data reveal that corporate buybacks are the dominant structural bid in U.S. equities. Since 2000, corporations have injected +$5.5 trillion in net flows, while pensions and mutual funds collectively withdrew –$2.7 trillion, and households plus foreign investors added +$2.4 trillion, yielding total net flows of roughly +$5.2 trillion. Without the corporate bid, passive index demand alone wouldn’t have absorbed the institutional liquidation, and the market would sit approximately 30% below current levels. The scale of individual authorizations underscores concentration risk: Apple announced $110 billion in 2024, Google added $70 billion, and together those two programs accounted for about 12% of the year’s total authorizations. A handful of mega-cap names drive a disproportionate share of market-wide demand.
The short-term relationship between buyback intensity and index performance is empirically tight. A four-week percentage-change overlay of buyback activity versus the S&P 500 shows a correlation near 0.85 over recent years, meaning weekly fluctuations in repurchase pace predict near-term index direction with high reliability. During one notable episode, a nearly 20% market decline in April was amplified by a sharp reversal in buyback flows. As stock prices fell, many companies paused programs to conserve cash or avoid catching a falling knife, removing the largest source of demand exactly when selling pressure peaked. This procyclical behavior, buying during rallies and pausing during selloffs, exacerbates volatility rather than dampening it.
Long-term return decomposition confirms buybacks aren’t a cosmetic detail. Over the past decade, buybacks contributed 27% of total S&P 500 returns, with that share peaking at 40.5% during the most aggressive repurchase phases. Multiple expansion accounted for 6.1% (peaking at 21%), earnings growth for 57.3% (peaking at 31.4%), and dividends for 9.1% (peaking at 7.1%). The dominance of buybacks in certain years means that any policy, tax, or macro shock that curtails repurchase activity can knock out a quarter to two-fifths of the equity market’s expected return, shifting risk-return assumptions for both active managers and strategic asset allocators.
Key historical statistics:
- Corporate buybacks provided +$5.5 trillion in net equity flows since 2000, the largest single source of demand.
- Pensions and mutual funds were net –$2.7 trillion sellers over the same period, making corporate repurchases essential to absorb institutional rotation.
- Short-term correlation between four-week buyback changes and S&P 500 performance: ~0.85.
- Buybacks accounted for 27% of total S&P 500 returns over the past decade, peaking at 40.5% in the most active years.
- Apple’s $110 billion and Google’s $70 billion programs in 2024 represented roughly 12% of that year’s total buyback authorizations.
- A nearly 20% market decline in one April episode was exacerbated by a simultaneous collapse in buyback flows, illustrating procyclical amplification risk.
Funding Buybacks: Cash Flow Strength, Debt Issuance, and Interest-Rate Sensitivity
Many firms fund repurchase programs not from free cash flow but by issuing debt, especially during periods of historically low interest rates. Borrowing to buy back shares can be accretive if the after-tax cost of debt is lower than the earnings yield on equity, but it also loads leverage onto the balance sheet and creates fixed obligations that must be serviced regardless of future operating performance. Federal Reserve data show that total corporate debt climbed to record levels during the last decade, rising in tandem with buyback activity and far exceeding prior cyclical peaks. Corporations effectively monetized cheap credit to shrink equity, boosting EPS and stock prices while increasing financial fragility.
The arithmetic works until interest rates rise or earnings falter. When rates climb, the cost of rolling over or issuing new debt increases, squeezing the spread between debt service and equity returns. At that point, debt-funded buybacks shift from accretive to dilutive on a cash-flow basis, and firms that over-leveraged during the low-rate era face a choice: cut buybacks to preserve liquidity, or continue repurchasing and risk credit-rating downgrades. S&P 500 companies spent $478 billion on buybacks in 2013 and an estimated $565 billion in 2014, much of it financed through bond issuance, and that debt must be refinanced in a higher-rate environment where the original buyback logic no longer holds.
Capital allocation strategy matters more than the absolute dollar amount. A company generating strong free cash flow that funds buybacks from operating cash, after maintaining capex, R&D, and working capital, demonstrates sustainable shareholder returns. A company borrowing to repurchase while free cash flow stagnates or turns negative is prioritizing short-term stock-price support over long-term solvency. The distinction becomes visible during downturns: cash-funded repurchasers can pause and restart buybacks opportunistically, while debt-funded repurchasers face covenant pressure, liquidity crunches, and forced asset sales if operating cash can’t cover both debt service and ongoing buybacks.
Risks of debt-financed buybacks:
- Interest-rate sensitivity means rising rates increase debt-service costs, eroding the accretion math and forcing buyback cuts to preserve cash flow coverage.
- Credit-rating pressure from elevated leverage ratios can trigger downgrades, raising borrowing costs and restricting access to capital markets during stress.
- Refinancing risk surfaces when debt issued at low rates must be rolled over at higher rates, converting an accretive liability into a dilutive one if equity returns don’t keep pace.
- Procyclical fragility hits firms that borrow to buy back during bull markets, forcing them to pause or reverse during downturns, amplifying volatility and removing price support when it’s most needed.
- Opportunity-cost lock-in happens because debt-funded buybacks commit future cash flows to debt service rather than growth investments, limiting strategic flexibility if market conditions or competitive dynamics shift.
Signaling Theory, Manager Incentives, and Behavioral Biases in Repurchase Decisions

A buyback announcement is supposed to signal management’s belief that the stock is undervalued, conveying private information about future earnings or competitive strength that the market hasn’t yet priced. In theory, this “signal of confidence” should cause investors to revise their valuations upward, bidding the stock higher on the expectation that insiders know something bullish. In practice, the signal is noisier: firms often repurchase when managerial optimism and equity prices are both elevated, precisely the conditions under which buybacks are least accretive, and they pause or cut programs after sharp declines, forfeiting the opportunity to repurchase at genuinely depressed valuations.
Survey evidence and compensation structures explain the timing bias. A Wall Street Journal CFO survey revealed that 93% of CFOs acknowledged pressure to influence stock price or manipulate reported earnings metrics, and executive pay packages heavily weighted toward stock options and performance shares create short-term incentives to boost EPS and stock prices regardless of long-run economic value. When vesting periods align with earnings seasons, managers have personal financial reasons to authorize buybacks that lift the stock into quarterly targets, even if that means borrowing at elevated valuations or sacrificing investment in higher-return projects. The agency problem is structural: the people deciding whether to repurchase benefit disproportionately from higher near-term prices, while long-term shareholders bear the opportunity cost and balance-sheet risk.
Behavioral finance confirms that managers exhibit the same cognitive biases as retail investors. Overconfidence during rallies, loss aversion during selloffs. Firms announce the largest buyback programs near market peaks, when confidence is high and capital is cheap, and they quietly suspend programs during panics, when valuations are low and repurchases would be most accretive. This procyclical behavior converts buybacks from a disciplined capital-allocation tool into a momentum-chasing exercise that destroys value by buying high and pausing low. The signaling theory assumes rational, informed insiders. The empirical record shows insiders who follow the crowd and optimize for next quarter’s earnings call rather than next decade’s competitive position.
How Compensation Structures Influence Buyback Timing
Executive compensation packages in the U.S. are dominated by stock options, restricted stock units, and performance shares tied to metrics like EPS growth, return on equity, and total shareholder return. Because buybacks mechanically lift all three (reducing shares outstanding boosts EPS and ROE, and the corporate bid supports stock-price appreciation), managers can hit vesting thresholds and bonus targets by authorizing repurchases even when operational performance is flat or declining. The result is predictable timing: buyback intensity peaks in the quarters leading up to option vests or performance measurement dates, and it falls during blackout periods or when stock prices have already rallied beyond strike prices.
This creates a feedback loop where compensation design drives capital allocation, and capital allocation drives short-term stock performance, which in turn justifies larger equity grants. Boards that tie pay to EPS growth without adjusting for buyback-driven share reductions effectively incentivize financial engineering over organic growth, and shareholders who focus on headline EPS beats without inspecting the denominator enable the cycle. The cleanest test is to compare firms with high insider ownership and long vesting periods, who tend to repurchase opportunistically during selloffs, against firms with frequent option refreshes and quarterly performance hurdles, who tend to buy back on a fixed calendar regardless of valuation.
Dividend Alternatives, Tax Efficiency, and Shareholder-Return Trade-Offs
Buybacks and dividends are both mechanisms to return cash to shareholders, but they differ in tax treatment, investor selection, and managerial discretion. Dividends distribute cash equally to all shareholders and trigger ordinary income tax in the year received, currently taxed at rates that can reach the top marginal bracket. Capital gains from buyback-driven price appreciation are taxed at preferential rates, ranging from 0% for lower-income taxpayers to 20% for high earners at the time of recent changes, and the tax is deferred until the investor sells, allowing the gain to compound tax-free for long-term holders. This asymmetry makes buybacks more tax-efficient for taxable accounts and especially attractive for investors in high tax brackets or those with loss-harvesting strategies.
Historical payout trends confirm the strategic shift. Over the past 33 years, companies reduced dividends as a percentage of net income while dramatically increasing buyback spending, indicating that boards view repurchases as a more flexible and tax-advantaged way to distribute cash. Buybacks can be paused or accelerated without triggering the negative signal that accompanies a dividend cut, giving management room to adjust payout policy as cash flow or investment opportunities change. Dividends, in contrast, are sticky. Once established, they create an expectation of continuity, and any reduction is interpreted as a distress signal that can crash the stock even if the cut is economically rational.
The trade-off for long-term shareholder returns depends on reinvestment alternatives and buyback execution quality. If a company has no projects that earn above its cost of capital, returning cash via buybacks or dividends is value-creating. The question is which form minimizes taxes and agency costs. If the company does have high-return reinvestment opportunities, buybacks funded by debt or at elevated valuations can destroy value by sacrificing growth for short-term EPS cosmetics. Return on equity can rise mechanically when buybacks shrink the equity base, but that increase is only economically meaningful if the firm maintains or grows absolute net income. Book value per share climbs, but total enterprise value may stagnate or fall if competitive position erodes.
Major differences in investor outcomes:
- Tax timing differs sharply: dividends trigger immediate taxable income, buyback-driven capital gains are deferred until sale, allowing tax-free compounding for long-term holders.
- Reinvestment flexibility varies: dividend recipients must find new investments or pay tax on unwanted cash distributions, buyback beneficiaries can hold shares and let the company’s bid support price appreciation without forced portfolio turnover.
- Signal durability separates the two: dividend cuts are interpreted as distress and punished severely, buyback pauses are often ignored or rationalized as prudent capital allocation, giving management more room to adjust.
- Wealth concentration patterns emerge: buybacks disproportionately benefit insiders and long-term shareholders who don’t sell, dividends distribute value equally to all holders, including those who may prefer current income over deferred capital gains.
Macro Conditions, Interest Rates, and Market Regimes That Shape Buyback Intensity
Buyback intensity is cyclical and highly sensitive to the interest-rate environment, corporate profitability, and overall market sentiment. During prolonged periods of near-zero rates, firms issued debt at historically low costs and used the proceeds to fund aggressive repurchase programs, lifting stock prices even as revenue growth remained modest. The equity market’s outperformance since the 2010s, producing double-digit returns in five of six consecutive years while GDP growth averaged 2 to 3%, was supported by elevated buyback levels that mechanically boosted EPS and absorbed institutional selling. As rates rise, the math reverses: debt becomes expensive, buyback-funded EPS growth slows, and the corporate bid that propped the market during the low-rate era disappears.
Recession considerations further constrain buyback activity. When earnings fall or uncertainty spikes, boards suspend repurchase programs to preserve cash and avoid signaling distress by buying a falling stock. This procyclical behavior removes the largest source of equity demand precisely when selling pressure peaks, amplifying downturns and increasing stock market volatility. The 2020 COVID shock illustrated the pattern: buybacks collapsed almost overnight as companies drew credit lines and cut discretionary spending, and the S&P 500 fell nearly 34% in a matter of weeks before fiscal and monetary intervention restored confidence and restarted corporate repurchase activity.
Bull market correlation with buyback intensity is empirically strong. Periods of rising stock prices, low volatility, and strong momentum coincide with record buyback authorizations and completions, while bear markets, volatility spikes, and credit-spread widening see sharp declines in repurchase activity. This feedback loop means buybacks are a stabilizing force during calm expansions but a destabilizing force during transitions. They prop prices on the way up and withdraw support on the way down, converting steady trends into sharper boom-bust cycles. Momentum trading strategies that rely on sustained upward price action depend implicitly on continued corporate buying. When that bid vanishes, momentum unwinds violently.
| Rate Environment | Buyback Behavior | Market Impact |
|---|---|---|
| Low / Zero Rates | Aggressive debt-financed repurchases; record authorizations and completions | Sustained upward pressure on stock prices; EPS growth outpaces revenue growth; valuation multiples expand |
| Rising / Normalized Rates | Slowing buyback pace; shift to cash-funded programs; some suspensions | Reduced demand cushion; increased volatility; P/E compression as EPS tailwind fades |
| Recession / Credit Stress | Sharp curtailment or suspension of buybacks; liquidity preservation prioritized | Loss of structural bid; amplified drawdowns; momentum reversal; increased correlation to fundamentals |
Final Words
We showed how buybacks cut float, create steady demand, and lift EPS, pushing prices up mechanically and through buyer flows.
The data backs it: trillions in net flows, a 0.85 short-term correlation, and announcement effects that often move stocks before repurchases begin. Execution method and funding change the move’s timing and size.
Watch authorizations, completion rates, and funding sources. Understanding how corporate buybacks impact stock price dynamics helps you tell optics from real profit growth — and find clearer entry points. That’s useful, not scary.
FAQ
Q: How do corporate buybacks directly affect stock price behavior?
A: Corporate buybacks directly affect stock price behavior by reducing shares outstanding, creating steady company demand, tightening float, and raising short-term price pressure via a clear supply‑demand imbalance.
Q: How do buybacks change EPS and valuation metrics?
A: Buybacks change EPS and valuation metrics by cutting share count, mechanically raising EPS even if net income is unchanged, often compressing P/E ratios and attracting valuation or momentum buyers.
Q: What evidence links buybacks to market returns and flows?
A: Evidence links buybacks to market returns through roughly $5.5 trillion in net buyback flows since 2000, a ~0.85 short-term correlation with the S&P and buybacks contributing about 27 percent of decade returns.
Q: How does the announcement of a buyback affect stock prices compared with actual repurchases?
A: The announcement of a buyback affects stock prices immediately by pricing expected demand; authorizations often lift shares before repurchases start, though actual execution and completion rates vary by company.
Q: How do different buyback methods—open-market, tender offers, and ASRs—impact pricing and liquidity?
A: Different buyback methods impact pricing and liquidity: open-market buys provide steady demand under safe-harbor rules, tenders/Dutch auctions can cause quick price jumps via premiums, and ASRs front-load float reduction and intraday volatility.
Q: What regulatory constraints govern buybacks and why do they matter for manipulation concerns?
A: Regulatory constraints govern buybacks via Rule 10b-18 safe harbor limits, blackout windows, and insider-trading rules; these limits reduce manipulation risk but shape timing, volume, and how repurchases influence price.
Q: Do companies use debt to fund buybacks and what risks does that create?
A: Companies do use debt to fund buybacks, especially in low-rate periods, creating risks like higher leverage, credit-rating pressure, reduced financial flexibility, and greater sensitivity to rising interest rates.
Q: How do manager incentives and signaling affect buyback timing?
A: Manager incentives and signaling affect buyback timing because executives use repurchases to signal confidence, boost EPS for compensation targets, and sometimes repurchase at elevated valuations for short-term optics.
Q: How should investors weigh buybacks versus dividends for shareholder returns and taxes?
A: Investors should weigh buybacks versus dividends by noting buybacks often provide tax‑efficient capital gains and EPS lift, while dividends deliver steady income—choice depends on tax status, income needs, and long-term goals.
Q: Which macro conditions increase buyback intensity and market impact?
A: Macro conditions that increase buyback intensity include low interest rates, strong free cash flow, and bull-market momentum; rising rates or recession risks typically curb debt-funded repurchases and their market support.
Q: What immediate mechanisms move stock prices when buybacks occur?
A: Immediate mechanisms that move stock prices during buybacks include share supply reduction, direct company buying, EPS accretion, positive signaling to investors, and reduced float raising price sensitivity.