

Think of the VIX as a market smoke detector.
It screams, but it doesn’t tell you where the fire is.
Many investors treat every VIX spike as a sell order and every low reading as permission to buy.
That’s a mistake.
The VIX measures option-implied 30-day volatility, not a direct buy or sell signal.
This post cuts through the noise.
You’ll learn what different VIX moves mean, why sudden spikes tend to reverse quickly while slow rises signal deeper trouble, and the practical steps to take: position sizing, hedges, and the indicators to watch next.
Core Concepts of the VIX and Its Purpose

The VIX, formally known as the CBOE Volatility Index, measures the market’s expectation of 30-day forward volatility for the S&P 500. Introduced in 1993, it calculates a weighted average of implied volatilities from near-term S&P 500 options, both puts and calls across multiple strikes. The result is a single number, quoted as an annualized percentage. When VIX reads 20, the market’s pricing roughly 20 percent expected volatility over the next month.
Investors call it the “fear gauge” because spikes typically coincide with market stress. When uncertainty rises, whether from economic data, geopolitical events, or credit shocks, demand for portfolio protection pushes option prices higher. That surge in implied volatility flows directly into the VIX calculation. Conversely, when markets are calm and confident, option buyers demand less protection. Premiums shrink. The VIX falls.
The index exists to give investors a real-time snapshot of market sentiment and risk appetite. Unlike price indices that tell you what happened, the VIX tells you what traders expect to happen. It condenses collective fear and uncertainty into a single metric that updates continuously during market hours.
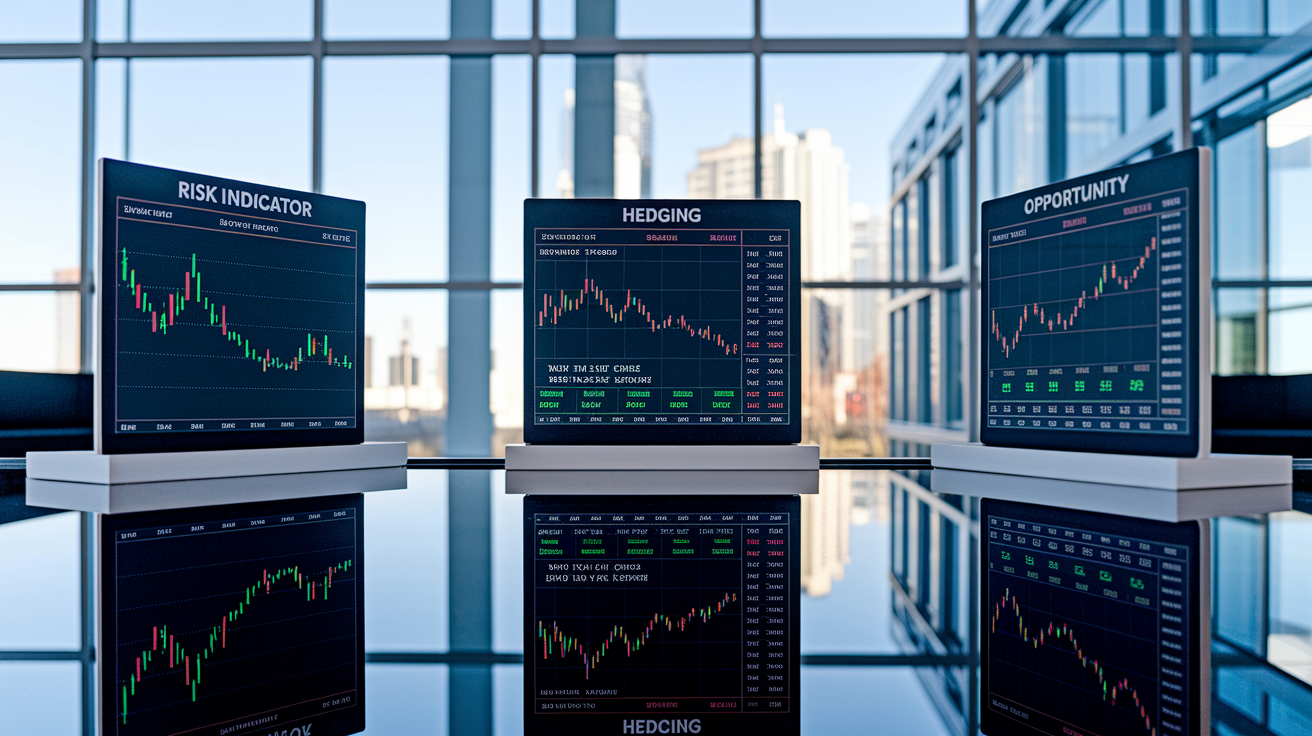
Investors use the VIX in four primary ways:
Risk indicator: A rising VIX signals increasing uncertainty and potential for larger price swings, prompting tighter risk controls.
Timing tool: Sharp VIX spikes often mark short-term panic. Reversals from extreme levels can indicate oversold or overbought conditions.
Sentiment gauge: Sustained low VIX readings suggest complacency. Prolonged elevated VIX points to persistent worry.
Hedging signal: Elevated or rapidly rising VIX levels trigger decisions to add protection, buying puts, reducing leverage, or entering volatility instruments.
Understanding VIX Levels and Their Implications

VIX readings fall into distinct zones that correspond to broad market conditions. A VIX below 12 indicates extreme calm. Often too much calm. Historically, these periods precede either stable markets or sudden shocks, because option sellers dominate and protection is cheap. Markets can stay quiet for months when VIX sits in the single digits, but complacency risk builds.
The 12 to 20 range defines normal market operation. Long-run VIX averages hover near 19, and most trading days over the past two decades fall into this band. Investors accept modest uncertainty, volatility gets priced fairly, and equities tend to grind higher or consolidate. Moves within this zone rarely trigger major portfolio adjustments.
Once VIX crosses 20, the market’s pricing elevated risk. Readings from 20 to 30 signal caution: larger daily swings, heightened news sensitivity, investor nervousness. Above 30, you’re in heightened fear territory. VIX above 40 marks extreme stress, often accompanying sharp drawdowns or systemic events. During the 2008 crisis, VIX spiked above 80 intraday. In March 2020, it closed near 82.7. Those extremes are rare but unforgettable.
| VIX Range | Interpretation | Typical Market Conditions |
|---|---|---|
| Below 12 | Very low volatility, possible complacency | Stable or rising equity markets; low option demand; low hedging costs |
| 12–20 | Normal range | Standard fluctuations; moderate uncertainty; balanced sentiment |
| Above 20 | Elevated to extreme fear | Increased selling pressure; rising hedging activity; potential for sharp moves |
How to Read VIX Movements and Trends

VIX doesn’t move in straight lines. Sharp, single-day spikes, say a jump from 15 to 25, often signal immediate panic triggered by unexpected news or price gaps. These spikes tend to mean-revert quickly unless the underlying catalyst persists. A one-day VIX surge above 40 percent usually indicates short-term capitulation or forced unwinding of positions. The market’s repricing risk fast.
Gradual VIX increases over several days or weeks tell a different story. If VIX climbs from 15 to 25 over two weeks, uncertainty’s building, not exploding. That sustained rise suggests deteriorating fundamentals, upcoming catalysts, or shifting sentiment. The longer VIX stays elevated, the higher the odds that equity weakness persists. Conversely, a slow decline from 30 to 20 over weeks signals stabilizing conditions and returning confidence.
Divergences between VIX and equity prices matter. If the S&P 500 makes new highs while VIX refuses to drop below 15, that disconnect warns of hidden stress. Investors are hedging despite rising prices. The opposite also signals: if equities fall modestly but VIX barely moves, the market may be discounting the drop as temporary noise rather than a trend change.
Speed and magnitude combined give the clearest signal. A VIX jump of 5 points in one session from a base of 15 is more alarming than a 5-point move from 30, because percentage change and rate of acceleration reveal how fast risk appetite’s collapsing.
To analyze VIX movement effectively, follow these steps:
Identify the trend: Check whether VIX is rising, falling, or range-bound over the past 5 to 10 sessions.
Compare to equities: Overlay VIX changes with S&P 500 price action to spot correlations or divergences.
Check options volume: Rising VIX with surging put volume confirms fear. Rising VIX with call volume suggests volatility traders are speculating, not hedging.
Evaluate magnitude: Measure the absolute point change and the percentage change to gauge intensity.
Assess duration: Determine whether the move’s a one-day shock or a multi-week regime shift.
VIX and Market Correlations
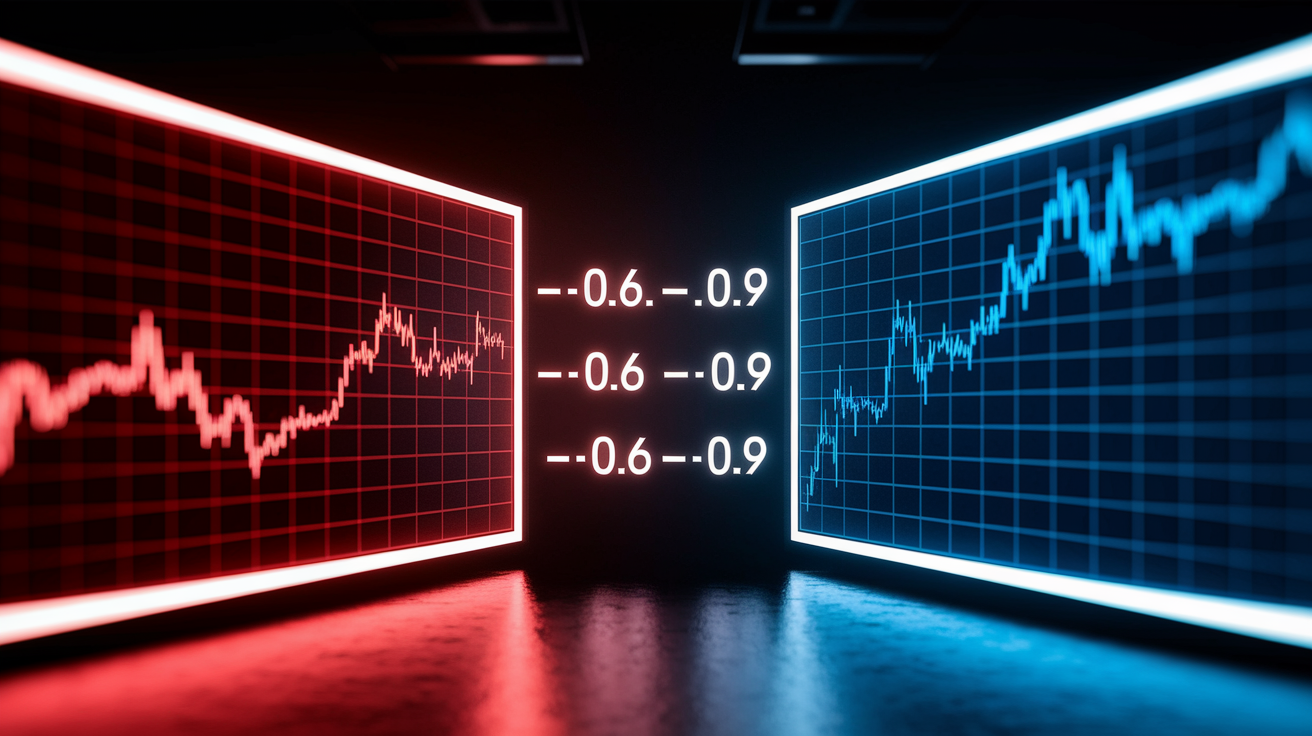
The VIX typically moves inversely to the S&P 500. When equities sell off, implied volatility rises as investors scramble for protection. When equities rally, confidence returns, option premiums decline, and VIX falls. This negative correlation isn’t a law of physics, but it holds in the vast majority of trading environments. During crisis periods, that correlation intensifies, often reaching −0.6 to −0.9. A 2 percent drop in the S&P 500 might coincide with a 20 to 30 percent spike in VIX.
The inverse relationship exists because options are asymmetric. Investors buy puts to hedge downside risk, and downside moves happen faster and more violently than upside moves. When markets drop, fear accelerates faster than greed on the way up. That structural bias keeps VIX elevated during selloffs and compressed during rallies.
Correlation strength varies. In calm, trending bull markets, VIX can drift lower even as equities consolidate or pull back modestly. The market discounts minor dips as buyable, so fear stays muted. But when uncertainty dominates, geopolitical shocks, rate surprises, credit events, the inverse correlation tightens. Extreme VIX readings above 40 or 50 historically coincide with capitulation-style selling, where panic drives both price and volatility to unsustainable levels. Those extremes often mark near-term bottoms, because once fear peaks, mean reversion begins.
Practical Strategies for Investors Using the VIX
The VIX offers more than a headline number. It gives actionable signals for portfolio management, risk control, and opportunity identification. Investors who track VIX levels and movements can adjust positioning before, during, and after volatility events.
Using VIX as a Risk Indicator
When VIX crosses above 20 and stays there, reduce leverage and tighten stops. Elevated VIX increases the probability of larger daily swings, so positions sized for a 1 percent average move may now face 2 to 3 percent swings. That means stop-losses hit more often, and drawdowns deepen faster. Prudent investors either cut position sizes or widen stops to avoid getting shaken out by normal volatility noise. If VIX climbs above 30, consider trimming high-beta or speculative holdings by 10 to 20 percent. The goal isn’t to exit equities entirely, but to right-size exposure for the current volatility regime.
Hedging with VIX Instruments
Short-term protection via VIX futures, VIX options, or VIX-linked ETPs can offset equity losses during spikes. For example, buying a small allocation of VIX call options, say 2 to 5 percent of portfolio value, provides a defined-risk hedge. If VIX jumps from 18 to 35, those calls gain value as equity portfolios decline. The trade-off is cost: VIX options decay quickly, and VIX futures suffer from contango in calm markets. Use these instruments tactically around known catalysts. Fed meetings, elections, earnings. Rather than as permanent hedges. Holding VIX exposure long-term erodes capital through roll costs and time decay.
Opportunity Identification
Extreme VIX readings signal potential turning points. VIX above 40 historically precedes equity bounces, because panic selling exhausts itself. When VIX spikes above 50 or 60, consider scaling into oversold equities or selling premium to capture elevated option prices. On the other end, VIX below 12 for extended periods signals complacency. That’s when patient investors can buy cheap protection or prepare for the next volatility regime. Low VIX doesn’t mean a crash is imminent, but it does mean hedges cost less and the market’s pricing minimal risk. If fundamentals or technicals start deteriorating while VIX remains compressed, that divergence offers early warning.
Real-World Examples of VIX Behavior

In October 2008, the VIX reached an intraday high near 89.5 as Lehman Brothers collapsed and the global financial system seized. Equity markets lost 30 to 50 percent over the following months, and the sustained VIX elevation above 40 persisted for weeks. Investors who tracked VIX levels above 60 recognized the market was pricing catastrophic outcomes. Those extreme readings eventually marked capitulation, and equities bottomed within months, though the recovery took years.
February 2018 delivered a sharp, short-lived VIX spike. The index jumped from the low teens to nearly 50 in a matter of days as volatility-targeting funds unwound and equity markets corrected roughly 10 percent. The spike reversed quickly. VIX was back below 20 within weeks. The lesson: not all VIX explosions lead to prolonged bear markets. This was a technical dislocation, not a fundamental crisis, and the quick mean reversion signaled the event was containable.
March 2020 saw VIX close at 82.7 on March 16 as COVID-19 lockdowns triggered global panic. Equities fell more than 30 percent in under a month, and the extreme VIX reading reflected uncertainty about the virus, economic shutdowns, and policy responses. Within weeks, central banks flooded markets with liquidity, VIX collapsed back below 30, and equities rallied sharply. The takeaway: VIX extremes can mark turning points, especially when policy or sentiment shifts quickly.
Key lessons from these events:
VIX above 60 signals systemic fear and often precedes short-term capitulation or turning points.
Short, violent VIX spikes can reverse quickly if the catalyst is technical rather than fundamental.
Sustained elevated VIX, staying above 30 for weeks, indicates persistent uncertainty and higher odds of continued equity weakness.
Avoiding Misinterpretations and Common Errors

The VIX isn’t a market direction forecast. A rising VIX tells you volatility’s expected to increase, not whether prices will go up or down. Markets can rally with elevated VIX. Uncertainty cuts both ways. High VIX doesn’t guarantee a crash. It signals wider expected price swings and higher hedging demand.
Another error is treating VIX-linked products as long-term investments. VIX ETPs and futures suffer from negative roll yield in contango, eroding value over time even if spot VIX stays flat. These instruments are designed for short-term tactical trades, not buy-and-hold. Investors who hold VIX ETFs through calm periods watch capital bleed away month after month.
Common misunderstandings to avoid:
Assuming low VIX means market strength: Low VIX can persist during slow, grinding bear markets or signal dangerous complacency before a shock.
Ignoring the futures curve: VIX options and ETPs price off futures, not spot VIX. Contango and backwardation materially affect returns and hedge effectiveness.
Overleveraging during high VIX: Elevated volatility increases the chance of hitting stops and suffering whipsaw losses. Tighter risk controls are essential, not optional.
Using single VIX readings in isolation: Always combine VIX levels with equity internals, volume, sentiment, and macro catalysts for context.
Final Words
In the action, we covered what the VIX measures, the key level buckets, how spikes and trends behave, and the VIX–S&P relationship, plus practical hedging and trading approaches.
Use the VIX as a risk signal, a sentiment check, and a trigger for hedges or reallocations. Remember common traps: it’s not a directional crystal ball and VIX products have quirks.
If you want a single takeaway on how to interpret VIX movements for investors: read levels, watch trend and divergence, then adjust exposure calmly. You’ll trade volatility with more confidence.
FAQ
Q: What does the VIX tell investors?
A: The VIX tells investors the market’s expected 30‑day S&P 500 volatility from option prices; higher readings mean more uncertainty, so use it as a sentiment and risk gauge to trim exposure or add hedges.
Q: At what VIX level should I buy stocks?
A: The VIX level at which you should buy stocks has no fixed cutoff; under 12 is low, 12–20 normal, above 20 elevated — consider buying incrementally after a VIX spike above 30 if fundamentals hold.
Q: How to interpret VIX price?
A: The VIX price is interpreted as expected annualized volatility over the next 30 days in percent; rising VIX signals growing fear, falling VIX signals calm, so compare levels to recent history and trend.
Q: What does a VIX of 20 mean?
A: A VIX of 20 means the market expects roughly 20 percent annualized volatility over the next 30 days; that implies moderate uncertainty, so watch breadth, flows, and upcoming data for confirmation.