

Don’t trust the headline durable goods number.
The total can be pulled around by a single aircraft order or a big defense contract and hide what really moves industrial stocks.
This post shows which series to read: core capital goods (nondefense ex-aircraft), shipments, backlog, and inventories, and how each drives machinery, equipment, and aerospace names.
You’ll get simple watchpoints, scenario calls, and the near-term levels that should change your positioning.
How Durable Goods Orders Shape Industrial Stock Behavior

Durable goods orders track new orders placed with U.S. manufacturers for stuff that’s supposed to last at least three years. Vehicles, aircraft, machinery, computers, appliances, industrial equipment. For investors, this monthly release from the Commerce Department works as a leading indicator of business investment, manufacturing activity, and the revenue pipeline for industrial companies. Orders eventually become shipments and revenue over the next few months to quarters, so sustained changes in durable goods orders usually show up in corporate earnings, production levels, and stock performance across the industrial sector before those things actually happen.
The headline figure lies constantly. September’s headline new orders rose 0.5 percent to $313.7 billion, but strip out transportation equipment and you get a 0.6 percent gain. Exclude defense and it’s just 0.1 percent growth. The series that actually matters for private sector capex—nondefense capital goods excluding aircraft—fell 0.9 percent to $94.0 billion. That divergence is everything. A positive headline driven by a single large defense contract or aircraft order tells you nothing about broad-based strength in machinery, electronics, and production equipment. Industrial stocks tied to private business investment respond to the core series. Not the headline.
When durable goods orders surprise higher and that strength shows up in core components, industrial stocks typically rally over the following days to weeks as investors anticipate higher production schedules, tighter capacity, revenue upgrades. A negative surprise in core capital goods often triggers downgrades to machinery and equipment manufacturers within hours of the release. Analysts model lower shipments three to nine months out. The magnitude of the stock reaction depends on whether the move was concentrated in volatile categories or reflected genuine demand shifts across multiple sub-sectors.
Breaking Down Durable Goods Orders Into Actionable Components
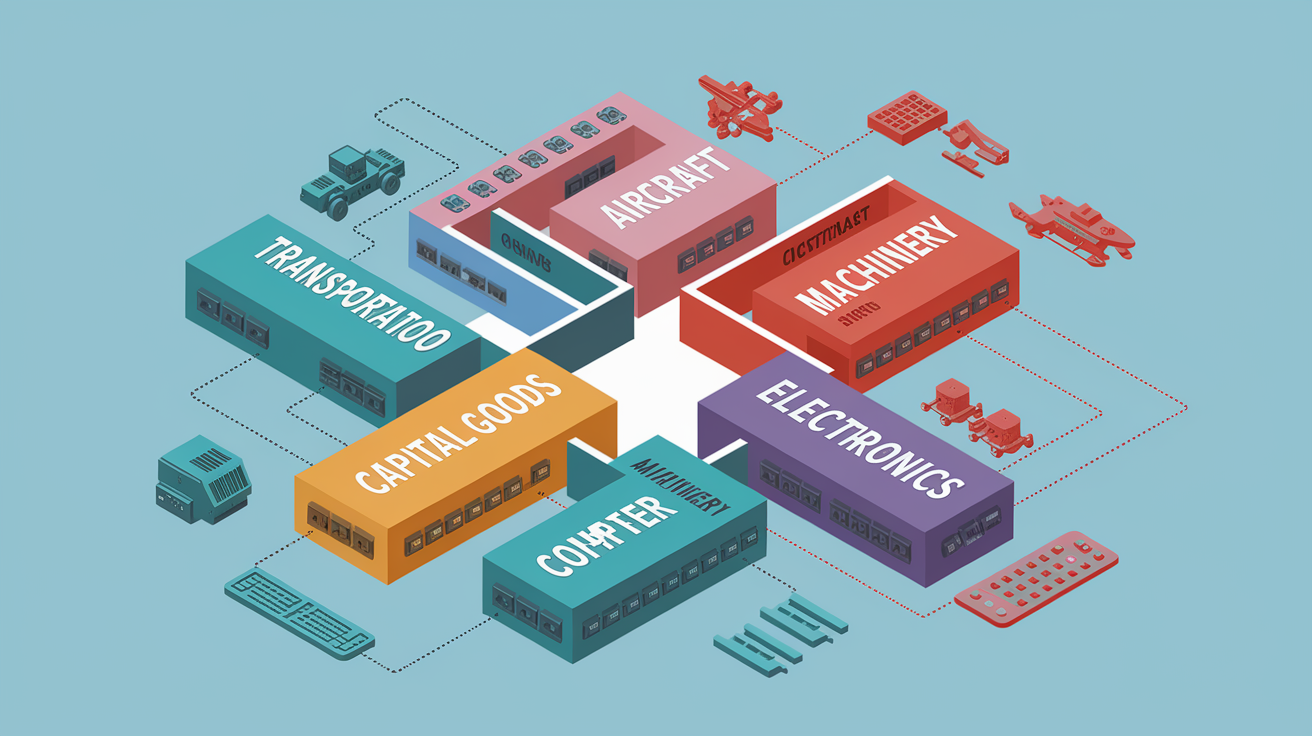
Treating durable goods orders as a single number is a mistake. It leads to misread signals and poor trade timing. The headline total hides enormous variation across components, and a move in one category can completely offset or exaggerate trends elsewhere.
Transportation equipment (aircraft, ships, trains, motor vehicles) often represents the largest dollar component and the highest volatility. In September, transportation orders rose just 0.4 percent to $110.7 billion. But this category routinely swings by billions of dollars in a single month when an airline places a 50 plane order or a defense contractor signs a multi year ship contract. These orders are real revenue for the manufacturer. They don’t signal broad industrial strength.
Defense capital goods surged 23.0 percent to $19.7 billion in September. Typical government procurement lump. Defense orders are driven by budget cycles and geopolitical decisions, not private sector capital allocation. Exclude defense when evaluating industrial capex trends. Defense contractors benefit from these spikes. Machinery and equipment suppliers don’t.
Aircraft orders are the single most distorting component. A $10 billion commercial aircraft order can boost the headline by more than 3 percentage points in one month and vanish the next. For aerospace suppliers, these orders are extremely valuable because they translate into multi year production schedules. For broader industrial analysis, aircraft should be stripped out to avoid false cyclical signals.
Machinery orders reflect demand for production equipment, metalworking tools, industrial automation. This category is one of the cleanest signals for private sector capex. It shows stronger correlation with business confidence and GDP growth than transportation dominated series.
Electronics and computers capture IT infrastructure and semiconductor capital equipment orders, which lead tech sector production and can signal shifts in corporate digital investment. Weakness here often shows up before slowing enterprise IT spending appears in software or cloud revenue.
Investors who react to a headline jump without checking whether it came from a single aircraft order or a defense procurement surge risk buying into false momentum. The September report is a textbook case. Headline growth of 0.5 percent looks stable, but the core nondefense capital goods ex aircraft decline of 0.9 percent to $94.0 billion signals private capex hesitation. That difference matters for machinery stocks, metals suppliers, industrial equipment manufacturers—categories that depend on broad business investment, not lumpy government contracts or airline fleet replacements.
Always separate the signal from the noise. If transportation or defense drove more than 50 percent of the monthly dollar change, treat the headline as sector specific news, not an economy wide capex indicator.
Using Core Capital Goods to Evaluate Industrial Stock Outlook

Nondefense capital goods excluding aircraft—commonly called core capital goods—is the single most important series for investors positioning in industrial stocks. This measure isolates orders for machinery, electrical equipment, fabricated metal products, and other production inputs that businesses buy when they’re confident enough to expand capacity or modernize operations. In September, core capital goods fell 0.9 percent to $94.0 billion. A warning sign that private sector capex momentum was weakening even as the headline appeared steady.
Core capital goods shipments are an even tighter leading indicator for industrial company revenues. Shipments represent actual deliveries and invoicing, not just promises to buy, so they flow directly into manufacturer top lines within weeks. Overall shipments rose just 0.1 percent to $307.7 billion in September, but machinery shipments climbed 1.4 percent. A pocket of strength. That machinery gain suggests production equipment manufacturers may see near term revenue support despite the broader softness in orders. Sustained increases in core shipments over three to six months typically precede earnings upgrades and multiple expansion in machinery and industrial equipment stocks. Consistent declines often trigger estimate cuts and sector underperformance.
| Metric | What It Indicates | September Reading | Expected Market Impact |
|---|---|---|---|
| Core capital goods orders (nondefense ex-aircraft) | Private sector capex demand | -0.9% to $94.0B | Negative for machinery stocks; suggests slower investment |
| Total shipments | Revenue recognition and near term sales | +0.1% to $307.7B | Neutral to slightly positive; limited momentum |
| Machinery shipments | Equipment manufacturer top line growth | +1.4% | Positive for industrial equipment OEMs |
| Core capital goods (3-month MA) | Smoothed capex trend, filters noise | Calculate from prior 3 months | Use for sector allocation decisions |
Reading Backlog, Unfilled Orders, and Inventories for Stock Signals

Unfilled orders—also called backlog—provide visibility into future production and revenue. Total unfilled orders rose 0.7 percent to $1.49 trillion in September, marking the 14th increase in 15 months. For capital goods specifically, unfilled orders jumped 2.0 percent to $209.7 billion. A rising backlog typically signals that demand is outpacing current production capacity, which supports higher utilization rates, pricing power, near term earnings visibility for manufacturers. When backlog growth accelerates while shipments remain steady or rise modestly, it often indicates supply constraints or long lead times rather than weak demand. A bullish signal for stocks tied to capacity constrained industries like aerospace and heavy machinery.
Inventories moved in the opposite direction, falling 0.1 percent to $589.8 billion for the second consecutive month. Transportation inventories declined 0.8 percent. The combination of rising backlogs and falling inventories is one of the strongest near term bullish configurations for industrial stocks. It suggests companies are shipping products faster than they’re replenishing stock, pointing to strong end market demand and limited risk of a destocking cycle. Rising inventories alongside flat or declining backlogs often precede margin pressure, production cuts, negative earnings revisions.
Investors can extract actionable signals by tracking four key indicators from the backlog and inventory data:
Backlog growth rate versus shipments growth. When backlog rises faster than shipments for three or more consecutive months, it signals tightening capacity and supports higher production schedules ahead.
Inventory to shipments ratio. A falling ratio (inventories declining faster than shipments) indicates lean supply chains and pricing leverage. A rising ratio warns of oversupply and potential discounting.
Unfilled orders by sector. Aerospace and defense backlogs can extend 12 to 36 months, providing long revenue visibility. Machinery backlogs convert in three to nine months, offering shorter cycle trade opportunities.
Year over year backlog trends. Sustained YoY growth in unfilled orders above 5 percent typically correlates with positive earnings revisions and outperformance in industrial stocks over the following six to twelve months.
How Durable Goods Orders Drive Sector Specific Stock Moves

Not all industrial sub-sectors respond equally to durable goods releases. A strong headline driven by aircraft orders can send aerospace suppliers higher while leaving machinery stocks flat. A surge in defense procurement may do nothing for metals producers. Understanding which components drive which stocks is essential for sector rotation and stock selection.
Aerospace and Transportation
Aerospace manufacturers and their supply chains are extraordinarily sensitive to aircraft orders and backlog changes, but with long lags. A $10 billion commercial aircraft order booked in September may not translate into meaningful revenue for 12 to 36 months as planes are built and delivered. But that backlog provides visibility and supports stock multiples immediately. Transportation equipment rose just 0.4 percent to $110.7 billion in September, but the 14 month streak of rising total unfilled orders suggests aerospace suppliers have strong revenue pipelines. Investors trading this sub-sector should focus on backlog trends and delivery schedules rather than monthly order volatility.
Machinery and Capital Goods
Machinery and production equipment stocks correlate most closely with core nondefense capital goods ex aircraft. The September decline of 0.9 percent to $94.0 billion is a cautionary signal for this group. When core capital goods fall for two or three consecutive months, it typically comes before weaker demand for industrial machinery, slower factory automation investment, reduced pricing power. The offsetting factor in September was machinery shipments, which rose 1.4 percent, indicating that existing backlog is still converting to revenue. Investors should monitor whether the orders weakness persists. If it does, machinery stocks are likely to underperform over the next three to nine months.
Metals and Suppliers
Metals producers and component suppliers react to both order volumes and inventory trends. Machinery shipments up 1.4 percent in September signals near term demand for steel, aluminum, fabricated metal products. Falling inventories across transportation equipment (down 0.8 percent) reduce the risk of a destocking cycle that would pressure commodity prices. When durable goods orders and shipments rise together while inventories fall, metals stocks often rally on expectations of tighter supply demand balances and pricing leverage. Rising inventories with flat orders typically lead to margin compression and stock weakness.
Defense Manufacturers
Defense contractors benefit directly from government procurement, which operates on a different cycle than private capex. The 23.0 percent surge in defense capital goods orders to $19.7 billion in September is a strong short term catalyst for defense focused industrials. It doesn’t indicate broader economic strength. These orders are driven by federal budget allocations and geopolitical events, not business confidence. Investors should treat defense order spikes as isolated positives for defense stocks and avoid extrapolating them to the broader industrial sector.
Interpreting Monthly Durable Goods Data: MoM, YoY, and Moving Averages
Monthly durable goods data is inherently noisy. A single large order can shift the headline by several percentage points. Seasonal factors can distort comparisons. Investors who react to raw month over month changes without smoothing the series risk trading on statistical noise rather than genuine economic signals.
Month over month percent changes capture immediate momentum but are subject to large swings. In September, headline orders rose 0.5 percent. That followed a 3.0 percent surge in August. Without context, the September slowdown could be misread as weakness when it may simply reflect normalization after an unusually strong prior month. Year over year percent changes smooth out monthly volatility and highlight longer cycle trends. A YoY decline in core capital goods signals a sustained downturn in business investment. YoY growth above 3 percent typically correlates with industrial earnings upgrades. Moving averages—especially three month and six month—filter single order distortions and reveal whether the underlying trend is rising, falling, or flat.
Five practical techniques transform noisy monthly data into usable signals:
Always compare headline to core. If headline moves in one direction and core moves in the other, trust the core and investigate which volatile component drove the headline.
Calculate a three month moving average. Sustained core orders growth above 1.5 percent (three month MA) signals expansion. Sustained decline below -1.5 percent signals contraction risk.
Track year over year growth rates. YoY changes above 5 percent indicate strong capex momentum. YoY declines lasting more than three months often precede industrial sector underperformance.
Flag large monthly surprises. A month over month surprise of ±1 percentage point is meaningful. ±3 percentage points is a large shock that can move stocks 2 to 6 percent over one to four weeks.
Monitor revisions. The advance release is often revised ±0.5 to 2.0 percentage points one week later. Treat initial prints cautiously and confirm with subsequent data before making large position changes.
| Metric Type | Best Use Case | Interpretation Guide |
|---|---|---|
| Month over month % | Intraday trading, headline reaction | High volatility; confirm with core series before acting |
| Year over year % | Medium term trend identification | Above +3% = expansion; below -3% = contraction |
| 3 month moving average | Sector allocation, stock selection | Smooths noise; use for position sizing and risk management |
Trading Durable Goods Releases: Timeframes, Signals, and Market Reactions

Durable goods releases offer multiple trading opportunities depending on time horizon and risk tolerance. The key is matching the data series and smoothing method to the intended holding period.
Pre release preparation. Review consensus estimates for headline, core, shipments. Identify which industrial stocks or ETFs have the highest beta to durable goods surprises. Limit position sizes to 0.5 to 2 percent of portfolio for event driven trades.
Read consensus versus actual. Focus on the difference between reported month over month percent and consensus forecast. A core capital goods surprise above +1.5 percent often supports long positions in industrial ETFs or selected machinery stocks.
React to headline surprise, but verify with core. If headline jumps 3 percent but core falls 0.5 percent, the headline is likely driven by aircraft or defense. Avoid broad industrial longs and instead focus on aerospace suppliers if the backlog also rose.
Differentiate transportation from broad strength. When transportation accounts for more than 50 percent of the monthly dollar change, treat the release as sector specific rather than economy wide. Adjust sector weights rather than overall equity exposure.
Use pairs and hedges. Go long machinery suppliers and short cyclical OEMs when shipments lag but backlog is shrinking. Flip when backlog grows and shipments accelerate. This isolates order book dynamics from macro risk.
Align timeframe with data lag. Day traders react to headline surprises within minutes. Swing traders hold one to twelve weeks and focus on core trends and three month moving averages. Investors use multi month backlog signals to position for three to eighteen month revenue cycles.
Typical market reactions follow predictable patterns. A core capital goods surprise of +1.5 to +3.0 percentage points versus consensus can drive industrial sector ETFs up 1 to 3 percent intraday and 3 to 7 percent over the following month, with the largest moves in machinery and equipment manufacturers. A negative surprise of similar magnitude often triggers 1 to 4 percent declines in the same timeframe. Volatility peaks within the first hour after the 8:30 AM ET release and typically fades by mid afternoon unless the surprise is extreme or coincides with other macro catalysts like Federal Reserve commentary or earnings guidance changes.
Incorporating Macro, Rates, and Cross Indicators Into Durable Goods Interpretation

Durable goods orders don’t exist in isolation. Strong orders can be negated by rising interest rates that increase the cost of capital. Weak orders may matter less if fiscal stimulus or supply chain normalization is driving industrial production. Pairing durable goods data with broader macro indicators prevents false signals and improves trade accuracy.
When durable goods orders surprise to the upside, the typical chain reaction includes a stronger U.S. dollar (reflecting growth optimism and potential Fed tightening) and higher Treasury yields (as bond markets price in stronger GDP and inflation risk). Those moves create headwinds for rate sensitive industrial stocks and can mute the equity rally even when order data is strong. Weaker than expected orders often push the dollar lower and yields down, which can support industrial stock multiples even as revenue outlooks dim. Investors must weigh whether the rate and currency moves amplify or offset the direct durable goods signal.
The most effective approach is to cross check durable goods trends with four complementary indicators before making sector allocation or stock selection decisions:
ISM Manufacturing PMI. Sustained divergence between rising durable goods orders and falling PMI new orders suggests the durable goods strength is concentrated in a few large contracts rather than broad demand. Treat such divergences as a caution flag.
Industrial production. If core capital goods orders are rising but industrial production is flat or falling, it indicates supply constraints or delivery delays. Backlog will grow but revenue conversion may lag.
Federal Reserve policy and yield curve. A 25 to 75 basis point move in 10 year Treasury yields on the same day as a durable goods release can override the order signal. Tightening financial conditions (rising real rates, inverting curve) often trump strong orders within weeks.
Corporate capex guidance and earnings commentary. If machinery and equipment companies are raising capex budgets and extending delivery times in earnings calls, it confirms the durable goods signal. If they’re cautious despite strong order data, it may indicate one off projects rather than a sustained cycle.
Managing Risk: Data Revisions, Single Large Orders, and Seasonal Effects
Durable goods data carries meaningful interpretation risks that can lead to poor trades and mistimed sector rotations. Understanding these pitfalls is as important as understanding the data itself.
The advance release is often revised by ±0.5 to 2.0 percentage points when the factory orders report is published about one week later. Investors who take large positions based on the initial print may find the signal reversed or weakened after revision. That revision risk is highest for volatile components like aircraft and defense, where a single order can be reclassified or delayed between the advance and final figures.
Five key risks demand attention every month:
Revisions. Treat the first print as a high frequency signal but confirm with the next one to two releases before increasing conviction or position size. Avoid over leveraging on advance estimates.
Volatile components. Aircraft and defense orders can produce more than 20 to 30 percent of the monthly dollar change. Always check whether transportation or defense drove the headline move before generalizing to the broader industrial sector.
Seasonality. Even though the data is seasonally adjusted, certain months (year end budget cycles, summer shutdowns) can show persistent patterns. Compare current readings to the same month in prior years, not just the prior month.
Supply constraints versus demand. Rising backlogs sometimes reflect production bottlenecks, labor shortages, or parts delays rather than strong demand. Pair backlog growth with supplier delivery times and input cost trends to distinguish the cause.
Macro overrides. A durable goods surprise of ±1 to 3 percentage points can be completely negated if interest rates move ±25 to 75 basis points on the same day. Always assess the net effect of the order signal plus the rate and currency reaction before sizing trades.
A Practical Durable Goods Interpretation Checklist for Industrial Investors

A repeatable monthly workflow ensures consistent interpretation and reduces the risk of reacting to noise. Follow these eight steps every time the durable goods report is released:
Compare headline to core. Read the headline month over month percent change, then immediately check core nondefense capital goods ex aircraft. If they diverge by more than 1 percentage point, investigate which component drove the gap.
Check shipments and inventories. Shipments lead revenue. Inventories signal supply demand balance. Calculate the shipments to inventories trend and flag any two month moves greater than ±5 percent.
Review unfilled orders (backlog). Rising backlog supports future production and revenue visibility. Compare the backlog growth rate to shipments growth to identify tightening or loosening capacity.
Strip out transportation and aircraft. Determine whether transportation or aircraft orders accounted for more than 50 percent of the headline change. If yes, treat the release as sector specific and adjust aerospace or defense positions rather than broad industrial exposure.
Assess defense contribution. If defense capital goods orders surged (as in September’s +23 percent), isolate that strength to defense contractors and avoid assuming it signals private sector capex strength.
Calculate three month and six month moving averages. Use these smoothed series to confirm trend direction. Sustained core capital goods MA growth above +1.5 percent month over month supports overweight positions in machinery and industrial equipment stocks.
Note consensus surprise magnitude. A surprise of ±1 percentage point is meaningful. ±3 percentage points is a large shock. Map the surprise to expected sector ETF or stock moves (typically 1 to 6 percent over one to four weeks for large surprises).
Cross check with macro and rates. Review same day Treasury yield moves, ISM PMI trends, recent corporate capex commentary. If rates rose sharply or PMI is falling, discount the positive durable goods signal and reduce position sizes accordingly.
Once the checklist is complete, apply the results to stock screening and sector allocation. For stock screening, prioritize companies with rising backlog to revenue ratios, falling inventory days, exposure to categories showing sustained order growth (machinery, electronics, metals). For sector allocation, overweight industrials when core capital goods show positive three month MA growth and cross indicators confirm. Underweight or hedge when core orders fall for two consecutive months, especially if paired with rising inventories and weak PMI. Position sizing should reflect the signal strength: a confirmed broad based order surge with macro tailwinds supports 5 to 10 percent sector overweights. Noisy single component moves warrant smaller tactical positions of 1 to 3 percent.
Final Words
in the action, durable goods orders are the signal that separates true capex demand from one-off noise.
This post covered headline vs core, component distortions, shipments, backlogs, sector responses, smoothing, trading steps, and a checklist.
Why it matters: core nondefense capital goods lead revenue and capex trends, while aircraft and defense can swing headlines. Backlogs and inventories show if demand converts to production.
Now what: when interpreting durable goods orders for industrial stocks, use the checklist: focus on core, revisions, shipments, and cross‑check PMI and yields. That keeps you positioned for upside.
FAQ
Q: What do durable goods orders measure?
A: Durable goods orders measure the dollar value of new orders placed with manufacturers for products meant to last three years or more, serving as a leading gauge of business investment and industrial demand.
Q: What are the 9 durable goods?
A: The nine major durable-goods categories commonly tracked include transportation equipment; machinery; computer and electronic products; electrical equipment, appliances and components; fabricated metal products; primary metals; furniture; instruments; and miscellaneous durable goods.
Q: What are the 4 economic indicators?
A: The four key economic indicators are gross domestic product (GDP), employment (jobs and unemployment), inflation (CPI or PCE), and interest rates—each shaping growth expectations, policy decisions, and asset prices.
Q: What are durable goods stocks?
A: Durable goods stocks are shares of companies that produce long-life products—aircraft, machinery, vehicles, industrial equipment—so performance closely follows capex cycles, order flows, and backlog-driven revenue visibility.