

What if the Fed pivots in weeks, not quarters?
Markets reprice in hours, not months.
A fast Fed flip can send 10-year yields down 30 to 70 basis points and reorder winners and losers across bonds, stocks, currencies, and commodities.
This post maps the three rapid-pivot paths – rate cuts, balance-sheet moves, and emergency liquidity tools – assigns odds, and lays out portfolio moves you can use.
Read on to see the trigger points, the most likely market moves, and three concrete steps to adjust risk.
Overview of Potential Rapid Pivot Pathways

Three pathways define how the Fed can pivot fast, and each one hits markets differently. Rate cuts deliver the clearest signal: 50 to 75 basis points in an emergency move, or back-to-back 25s at consecutive meetings. The balance sheet pivot stops quantitative tightening or restarts asset purchases to fix liquidity problems without touching rates. The liquidity pivot turns on emergency facilities like standing repo lines, discount window expansions, or sector backstops to contain financial stress while the policy rate stays put.
Markets don’t wait weeks to reprice. They move in hours or days.
A rate-cut pivot usually drops 10-year Treasury yields 30 to 70 basis points in the first week. Investors front-run the steepening curve and term premia compresses fast. Equity futures gap higher on the news, but duration-heavy sectors like utilities and REITs post the biggest single-day pops, often 3 to 6 percent. A balance sheet pivot stabilizes repo markets and funding spreads first, then flows through to risk assets via better liquidity and tighter credit spreads. A liquidity pivot can narrow financial conditions indexes sharply but leave rate expectations untouched if the Fed frames it as technical, not policy.
What ties all three together is the reversal of the previous tightening story. When the Fed shifts, it rarely eases in. Rapid pivots follow sharp breaks: unemployment spikes, systemic funding stress in credit or banking, or sudden inflation drops that open room for quick reversal. That creates a narrow window where positioning hasn’t caught up to the signal yet, and early movers grab most of the asset-price move before consensus figures it out.
Three Most Likely Pivot Types:
- Rate-cut pivot: Emergency or consecutive cuts totaling 50 to 100 basis points inside three months, triggered by unemployment jumps or inflation falling below 2.4 percent.
- Balance sheet pivot: QT pause or restarting asset purchases to stop liquidity drainage, usually paired with soft guidance that rates stay on hold.
- Liquidity pivot: Launch of sector facilities (bank term funding, commercial paper backstops, standing repo expansion) to relieve acute funding stress without changing rate policy.
Probability Assessment of Pivot Types

Putting odds on each pathway means mapping macro triggers to how the Fed has reacted historically. A rate-cut pivot carries 35 to 45 percent odds over the next 12 months if two straight payroll prints come in under 100,000, or if core PCE inflation holds below 2.5 percent for three months running. Regional bank stress or commercial real estate trouble lifts the probability of a liquidity pivot to 20 to 30 percent, especially if credit spreads in investment-grade corporates push past 150 basis points.
A balance sheet pivot sits at 15 to 25 percent probability in the base case. But those odds climb fast if reserves drop below the Fed’s comfort zone, roughly 10 to 12 percent of GDP, or if overnight repo volatility spikes above 20 basis points. The Fed prefers to treat QT as background policy. Still, if market dysfunction shows up through persistent Treasury fails or collateral shortages, the central bank steps in within weeks.
Scenario modeling usually runs three frames: base case assumes gradual normalization with no pivot, bull case assumes soft-landing cuts, and stress case assumes recession-driven emergency easing. Probabilities shift every month as new data changes the balance of risks. Institutions recalibrate their scenario weights after every FOMC meeting and every major labor or inflation print.
| Scenario | Trigger Conditions | Estimated Probability |
|---|---|---|
| Rate-cut pivot | Unemployment rises ≥50 bps; core PCE <2.5% for 3 months; payrolls <100k twice | 35–45% |
| Balance sheet pivot | Reserves <10% GDP; repo volatility >20 bps; Treasury fails spike | 15–25% |
| Liquidity pivot | IG credit spreads >150 bps; regional bank stress; commercial real estate defaults | 20–30% |
Asset-Class Impact Mapping

Bonds move first and move hard. Treasury yields fall 30 to 70 basis points in the week right after a rapid pivot announcement. The front end drops faster if cuts get priced quickly. Duration extends across portfolios as investors scramble to lock in yield before the Fed finishes the easing cycle. Investment-grade credit spreads tighten 20 to 50 basis points as lower rates cut refinancing risk and lift coverage ratios. High-yield spreads compress 80 to 150 basis points if the pivot feels stabilizing instead of recessionary.
Equities rally on the headline, but the mix changes. Growth stocks and long-duration names win in the first 48 hours, especially if the pivot is pre-emptive and not paired with earnings downgrades. If the pivot follows a sharp break in labor or credit, defensive sectors outperform: utilities, consumer staples, healthcare capture the relative gains while cyclicals lag. Small caps and leveraged names get a boost from lower discount rates, but only if credit stays available.
Currencies adjust through rate differentials and risk tone. The dollar weakens 2 to 5 percent on a trade-weighted basis within two weeks of a dovish pivot, as front-end rate expectations reprice lower versus other central banks. Dollar weakness picks up speed if the pivot is unilateral and the ECB or Bank of Japan stay on hold. Gold rallies 3 to 8 percent in the first month, driven by lower real yields and safe-haven flows if the pivot signals trouble rather than a policy tweak.
Commodities split by type. Energy often rallies 2 to 6 percent on the idea that easier financial conditions prop up global demand and weaken the dollar, making dollar-priced commodities cheaper for foreign buyers. Industrial metals follow risk sentiment. If the pivot stabilizes things, copper and aluminum gain. If it’s recessionary, they sell off despite easier policy. Ag commodities don’t move much unless the pivot lines up with weather shocks or supply breaks.
Asset-Class Sensitivities:
- Bonds: 10-year Treasury yields drop 30 to 70 bps; IG spreads tighten 20 to 50 bps; HY spreads compress 80 to 150 bps.
- Equities: Initial rally 2 to 8 percent, with growth and rate-sensitive sectors leading if the pivot is pre-emptive; defensives win if the pivot follows distress.
- Currencies: USD weakens 2 to 5 percent trade-weighted; EM currencies rally if dollar weakness sticks.
- Commodities: Gold gains 3 to 8 percent; energy rallies 2 to 6 percent on weaker dollar and demand bets; industrial metals track risk tone.
Sector-Level Effects of a Rapid Pivot
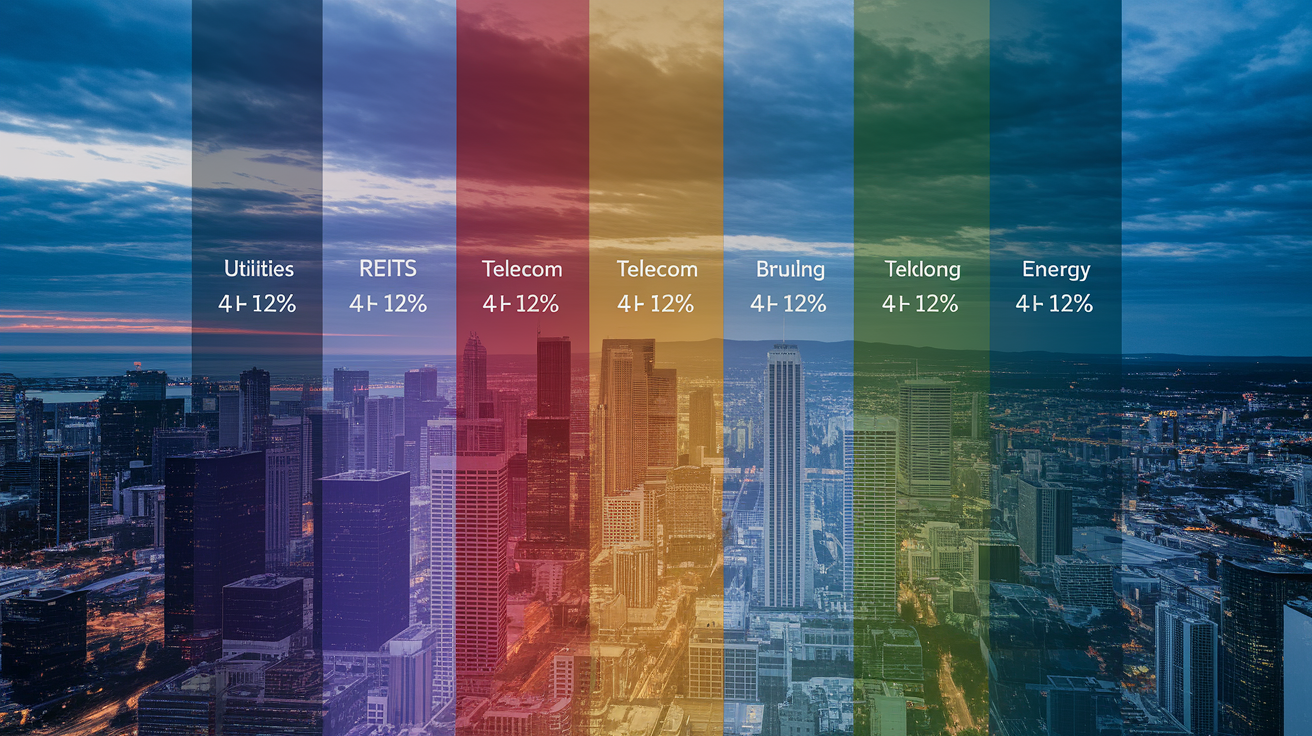
Rate-sensitive sectors respond fastest. Utilities, REITs, and telecom stocks rally 4 to 10 percent in the first week as lower discount rates lift the present value of long-dated cash flows. Technology, especially high-growth names with little current earnings, gains 6 to 12 percent if the pivot comes with stable or better forward guidance. Housing-related equities benefit as mortgage rates fall and affordability improves, though the effect shows up a few weeks later as buyers adjust to the new rate picture.
Cyclicals give mixed signals. Industrials and materials lag if the pivot follows bad demand data, even though lower rates should theoretically help capex and borrowing. Consumer discretionary splits: auto and home-improvement stocks react fast to cheaper financing, while luxury and travel names wait until consumer confidence firms up. Energy holds up better than other cyclicals because lower rates cut production financing costs and the weaker dollar supports international pricing.
Defensives win on a relative basis when the pivot is recessionary, but they lag in absolute terms if the pivot is a soft-landing adjustment. Healthcare and consumer staples offer downside cover, gaining 1 to 3 percent while cyclicals drop, but they miss the upside if risk appetite snaps back. Financials face a messy trade: banks take net interest margin pressure as the curve flattens or inverts, but credit-card and consumer-finance units benefit from lower funding costs and less default risk if the pivot stabilizes the economy.
Sector Reactions:
- Utilities, REITs, Telecom: Rally 4 to 10 percent in the first week; long-duration cash flows get repriced higher.
- Technology (growth): Gains 6 to 12 percent if the pivot is pre-emptive; discount-rate relief drives valuation expansion.
- Financials (banks): Mixed; net interest margin pressure offsets lower credit risk; usually flat to down 2 to 5 percent.
- Consumer Discretionary: Auto and housing names rally 3 to 8 percent; luxury and travel wait for demand confirmation.
- Energy: Holds up 0 to 4 percent; weaker dollar and lower production financing costs give support despite demand uncertainty.
Historical Parallels and Lessons
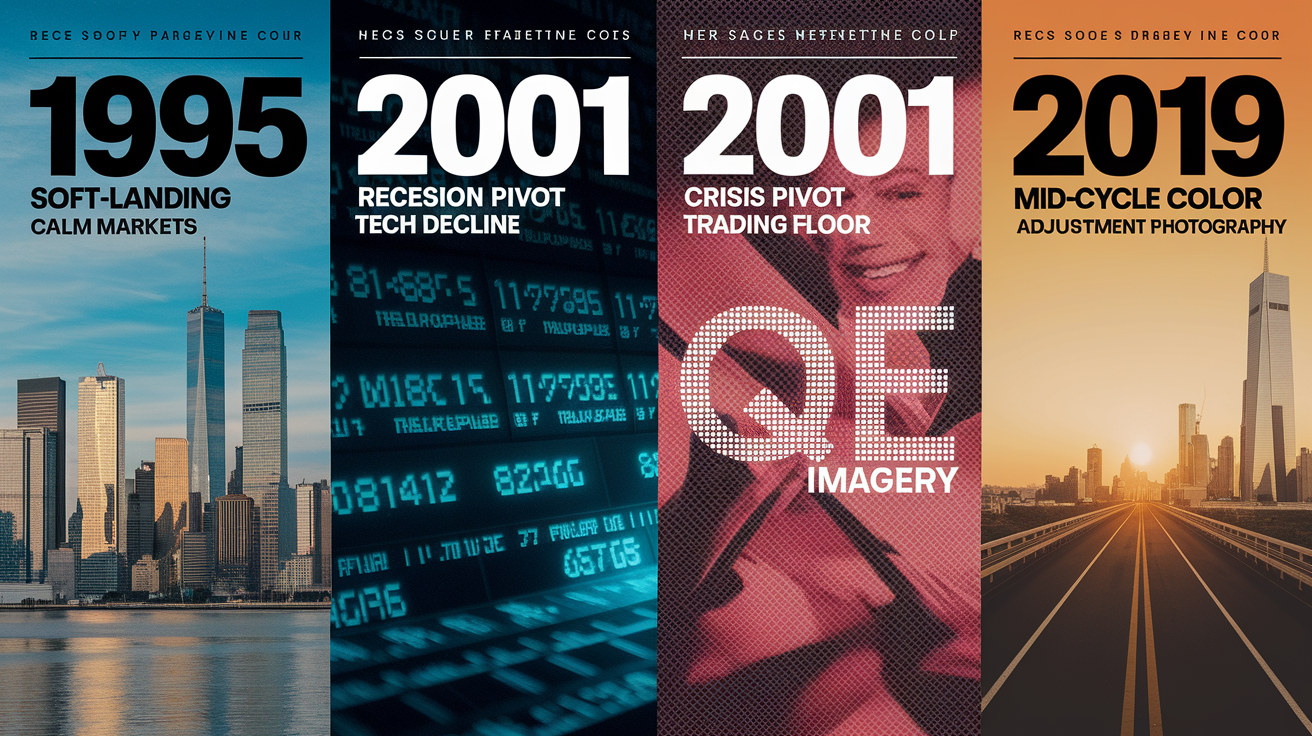
Four episodes give you the playbook. The 1995 soft-landing pivot delivered three 25-basis-point cuts after the Fed had hiked through 1994 to contain inflation. The cuts arrived as growth slowed but before recession landed. Equities rallied about 20 percent over the next year and the 10-year Treasury yield fell around 100 basis points. Credit spreads tightened, the dollar weakened a bit, and risk assets got a clean backdrop without a full credit cycle turning.
The 2001 recession pivot started with a surprise 50-basis-point inter-meeting cut in January, then kept going with aggressive easing that totaled 475 basis points over the year. Equities popped initially but rolled over as corporate earnings collapsed and the tech bubble kept deflating. Bonds posted strong returns, roughly 8 percent for the Bloomberg U.S. Aggregate, but the equity rally didn’t last because the pivot came after, not before, the recession.
The 2008 crisis pivot combined rate cuts, balance sheet expansion, and emergency liquidity. The Fed cut rates to near zero and launched multiple QE programs. Equities still fell 34 percent peak to trough in early 2009 before recovering. The takeaway: when the pivot addresses systemic credit stress, initial market rallies often fail until the underlying solvency and liquidity mess gets cleaned up. Bonds rallied hard, Treasury yields fell more than 200 basis points, and credit spreads blew out before stabilizing months later.
The 2019 mid-cycle adjustment gave three 25-basis-point cuts as insurance against trade war risks and slowing global growth. Equities rallied roughly 30 percent from late 2018 lows into early 2020, and the pivot extended the expansion without tipping into recession. This one shows that pre-emptive pivots, when credit conditions stay healthy, can deliver sustained risk-asset gains and compressed volatility.
| Year | Type of Pivot | Trigger | Market Response |
|---|---|---|---|
| 1995 | Soft-landing cuts | Slowing growth, stable inflation | Equities +20% over 12 months; 10-year yield -100 bps; spreads tightened |
| 2001 | Recession pivot | Tech bust, corporate earnings collapse | Bonds +8%; equities rallied then declined; cuts totaled 475 bps |
| 2008 | Crisis pivot + QE | Financial crisis, credit freeze | Equities -34% trough; Treasuries rallied >200 bps; spreads blew out then stabilized |
| 2019 | Mid-cycle adjustment | Trade risks, global slowdown | Equities +30% from late-2018 lows; expansion extended; volatility compressed |
Macro Triggers and Forward Timeline Expectations

The clearest trigger is unemployment flipping. When the unemployment rate climbs 40 to 60 basis points over two or three months, the Fed historically shifts its stance within weeks. Payroll prints below 100,000 for two straight months often lead to emergency inter-meeting cuts or faster easing at the next scheduled FOMC meeting. CPI or core PCE dropping below 2.5 percent year-over-year for three months running removes the inflation roadblock and opens the door for rapid cuts.
Credit stress shows up in spread moves. Investment-grade corporate spreads crossing 150 basis points, or high-yield spreads topping 500, signal tightening financial conditions the Fed watches closely. Regional bank stress, measured by deposit outflows above 10 percent in a quarter or a batch of credit downgrades, often forces liquidity pivots even when the policy rate stays frozen. Commercial real estate trouble, like delinquency rates above 5 percent or valuation drops past 20 percent, can trigger targeted facilities or balance sheet moves.
Liquidity stress appears in repo and Treasury markets. Overnight repo rates spiking more than 20 basis points above the effective federal funds rate, or persistent fails in Treasury settlement, usually push the Fed to expand standing repo or adjust reserve supply. These moves can happen within days of the first stress signal, especially if the dysfunction threatens broader market function.
Typical Pivot Timeline:
- Days 1 to 10: Macro trigger appears (payrolls miss, inflation falls, spreads widen); market reprices Fed expectations; Fed officials start signaling they’re paying attention.
- Days 10 to 30: More data confirms the shift; Fed talk moves from hawkish to neutral or dovish; forward guidance shifts; market prices first rate cut within 60 to 90 days.
- Days 30 to 60: FOMC meeting delivers first cut or announces balance sheet/liquidity adjustment; initial asset-price moves hit (yields fall, equities rally, dollar weakens).
- Days 60 to 120: Follow-on cuts or facility expansions roll out; market tests whether the pivot is enough; credit conditions and employment data decide if the easing cycle keeps going or pauses.
Portfolio Positioning and Institutional-Grade Strategies

Duration extension is the main institutional move. Adding 0.5 to 2.0 years of effective duration to fixed income captures the yield drop and price pop that comes with rate cuts. Investors usually shift from short-dated Treasuries and investment-grade corporates into 7 to 10 year maturities, or add exposure to long-duration sectors like utilities and REITs in equity sleeves. The move happens early, often before the Fed’s first cut, because waiting until the pivot is official gives up most of the available return.
Trimming cyclical beta protects if the pivot follows bad fundamentals. Institutions cut overweights in industrials, materials, and discretionary consumer by 3 to 8 percent of the equity sleeve, shifting into healthcare, utilities, and quality growth. The rotation keeps equity exposure but lowers sensitivity to earnings misses. Some managers pair this with modest cash or T-bill bumps, typically 2 to 5 percent of assets, to fund opportunistic buys if volatility spikes.
Gold and volatility hedges get bigger allocations as macro uncertainty climbs. Putting 1 to 3 percent of total portfolio value into gold or gold ETFs hedges both recessionary pivots and currency weakness. Volatility strategies like buying 3 to 6 month put spreads on equity indexes or VIX call spreads cost 0.5 to 1.5 percent of portfolio value but cap tail losses if the pivot doesn’t stabilize markets. Institutions often finance these hedges by selling out-of-the-money calls on existing equity positions, building a collar that limits upside but zeroes out the premium cost.
Credit rotations favor high quality over high yield early in a rapid pivot. Investors trim high-yield exposure by 5 to 15 percent of the credit sleeve, moving into investment-grade corporates or agency mortgage-backed securities that benefit from lower rates without carrying default risk. Once the pivot is confirmed and credit spreads stabilize, some managers selectively re-enter high yield, targeting issuers with solid balance sheets and stable cash flows that can refinance cheaper.
Commonly Used Hedges and Rotations:
- Duration add: Extend by 0.5 to 2.0 years through 7 to 10 year Treasuries or long-duration corporates; capture yield compression and price gains.
- Cyclical trim: Cut industrials, materials, discretionary by 3 to 8 percent; shift into healthcare, utilities, quality growth for downside cover.
- Gold allocation: Add 1 to 3 percent to hedge currency weakness and recessionary risk; works alongside fixed income duration plays.
- Options overlay: Put 0.5 to 1.5 percent into 3 to 6 month equity put spreads or VIX calls; finance with short calls to build zero-cost or low-cost collars that limit tail risk.
Final Words
When a rapid Fed pivot lands, markets reprice fast: rate cuts, balance-sheet moves, or emergency liquidity determine the immediate winners and losers.
We assessed probabilities, mapped bond, equity, and FX responses, outlined sector effects, reviewed historical parallels, set a 30-120 day timeline, and sketched institutional positioning.
Watch payrolls, CPI, credit spreads and positioning; tilt into duration, gold, and high-quality credit while keeping volatility or swap hedges ready.
This scenario analysis for a rapid Fed pivot gives concrete watchpoints and trade sketches, not a prediction—just a playbook you can use to protect capital and capture early upside.
FAQ
Q: What are the 6 Irrbb scenarios?
A: The six IRRBB scenarios are parallel up, parallel down, steepener, flattener, short‑rate up, and short‑rate down—standard shocks banks use to test banking‑book sensitivity to rate moves and earnings impacts.
Q: Will the Feds lower interest rates again in 2026?
A: Whether the Fed lowers rates in 2026 depends on incoming data; payrolls dropping more than 150k, inflation under 2.4 percent, or material credit stress would materially raise the odds.
Q: What is a Fed pivot?
A: A Fed pivot is a shift in policy direction—usually from tightening to easing or vice versa—driven by growth, inflation, or financial stress and quickly repriced across markets.
Q: How many CCAR scenarios are there?
A: There are three CCAR scenarios: baseline, adverse, and severely adverse, used annually by the Fed to stress‑test large banks’ capital adequacy and planned distributions under stress.