

What if common duration rules steer you wrong because they ignore how different parts of the yield curve move?
Short and long yields rarely march together.
When the front end drops faster than the long end, 2- to 5-year notes gain more per unit of duration than 30-year bonds.
When the belly or wings lead, positions that look safe can blow up.
This post shows how to read steepening, flattening, and curvature, then turn those signals into concrete duration actions and the levels and indicators that should change your bets.
Applying Yield Curve Signals Directly to Duration Positioning Decisions

Portfolio duration doesn’t respond uniformly across curve shifts because short rates and long rates move at different speeds. When short rates drop faster than long rates (bull steepening), the 2-year sector delivers more capital gain per duration unit than the 10-year. Once the front end has already moved, pushing duration out to 30 years captures less incremental yield decline. In bear steepening, long yields climb harder while the front end stays pinned, so excess duration at the belly or long end amplifies mark-to-market losses. Knowing which part of the curve is moving, and how much, tells you where to add or cut duration.
Parallel shifts affect all maturities equally, so key rate durations line up with modified duration and the choice simplifies to carry versus capital risk. Non-parallel shifts break that symmetry. Bear flattening driven by front-end hikes erodes carry at the short end while long bonds hold yield, rewarding duration beyond five years. Bull flattening, where long yields fall more, rewards overweighting 10s and 30s versus 2s. The balance between duration risk and carry capture shifts constantly. High carry at the front end offsets roll-down erosion when the curve inverts, but that same carry evaporates if the Fed pivots and short rates gap lower.
Duration actions by shift type:
Bull steepening: Add duration at the front end (2 to 5 years) where yield declines are steepest. Trim back-end exposure if term premium stays elevated.
Bear steepening: Shorten aggregate duration and underweight the long end to limit capital losses. Maintain neutral or slight overweight at the belly if carry compensates for modest yield rise.
Bull flattening: Overweight long-end duration (10 to 30 years) to capture bigger yield declines. Reduce front-end exposure where rate cuts are already priced.
Bear flattening: Cut front-end duration aggressively as short rates rise. Hold or modestly add long-end duration if term premium compresses and long yields lag the move.
Frameworks for Analyzing Yield Curve Movement and Duration Impact

Macro signals provide the first layer of curve analysis. Labor-market softening (rising unemployment, falling job openings) typically precedes bull steepening because it shifts Fed expectations toward cuts, compressing short rates faster than long rates adjust. Inflation trajectory matters separately. Sustained disinflation allows long yields to fall (bull flattening), while sticky core inflation keeps term premium elevated even as the front end rallies. Fiscal issuance acts as a supply shock. Heavy Treasury auction calendars push long yields higher independent of Fed policy, creating bear steepening when short rates stay pinned. Political decisions (tax cuts, spending surges) amplify these supply effects. Watching these macro drivers in real time lets you anticipate which segment of the curve will move first and by how much.
Forward rates and term premium estimates gauge whether the current curve shape reflects fair expectations or temporary distortions. If market-implied forward rates for 2-year yields twelve months out sit well above your macro forecast for the Fed Funds rate, the front end is rich and vulnerable to bull steepening. Term premium (the extra yield investors demand for holding longer maturities) can be estimated from model outputs or inferred from breakeven inflation and real-rate curves. When term premium spikes above historical norms (late 2023 saw this as issuance surged), long-end yields embed compensation for supply risk rather than growth expectations, creating tactical opportunities to fade that richness once supply ebbs. Comparing forward-implied paths to your independent rate forecast highlights mispricings that justify duration tilts.
Using PCA to Identify Curve Factors
Principal component analysis decomposes historical yield-curve changes into three orthogonal factors: level, steepness, and curvature. The level factor captures parallel shifts and typically explains 85 to 90 percent of total variance. When level dominates, adjust overall portfolio duration rather than chasing maturity-specific bets. The steepness factor isolates 2s10s or 2s30s slope changes and accounts for 8 to 12 percent of variance. Steepness moves signal business-cycle transitions and justify tactical steepeners or flatteners. Curvature (often called butterfly) measures how the belly (5-year area) moves relative to wings (2-year and 10 or 30-year). It explains 2 to 4 percent of variance but spikes during policy shifts or liquidity events. Monitoring these three factors in real time tells you which duration levers to pull and whether a move is systematic or idiosyncratic noise.
Optimizing Duration Allocation Along the Curve Using Key Rate Durations

Key rate duration measures price sensitivity to a one-basis-point shift in yield at a single maturity point, holding all other points constant. Non-parallel shifts make aggregate modified duration insufficient for risk management. A portfolio with 6.0 modified duration might hold 2.5 units at the 2-year, 2.0 at the 5-year, and 1.5 at the 10-year, and those buckets react differently when the 2s10s curve steepens by 50 basis points. Discrete maturity analysis lets you overweight the sector where yield change is most favorable and underweight where it hurts. If you expect bull steepening, load key rate duration at the 2 and 3-year points where yields will fall fastest, and trim the 30-year bucket where yields may decline only modestly. This granular approach turns curve views into precise position sizing.
The 5-year “belly” frequently delivers high risk-adjusted hedging impact because it sits at the intersection of Fed policy expectations and term premium. Short of five years, yields track Fed Funds projections closely. Beyond ten years, term premium and fiscal dynamics dominate. The 5-year point blends both, so it tends to move in a balanced way during most curve shifts, providing diversification without excessive convexity or liquidity cost. Multi-asset portfolios often anchor duration overlays around the 5-year swap or Treasury, adjusting from that center point rather than committing entirely to the long end. A static long-Treasury hedge underperforms when bear steepening hits, because 30-year bonds sell off more than equities rally. Shifting duration dynamically across the 2 to 10-year range, centered near five years, captures hedging benefits while preserving carry and limiting tail risk.
| Curve Segment | Duration Sensitivity Role |
|---|---|
| Front end (0–3 years) | Highest sensitivity to near-term Fed policy changes; low term premium; roll-down accelerates in flat or inverted curves. |
| Belly (4–7 years) | Balanced exposure to policy expectations and term premium; typically offers best Sharpe ratio for duration hedges; liquid and efficient to trade. |
| Long end (10+ years) | Dominated by term premium and fiscal supply; higher convexity; largest capital gains in bull flattening but amplifies losses in bear steepening. |
Tactical Duration Positioning Through Steepeners, Flatteners, and Curvature Trades
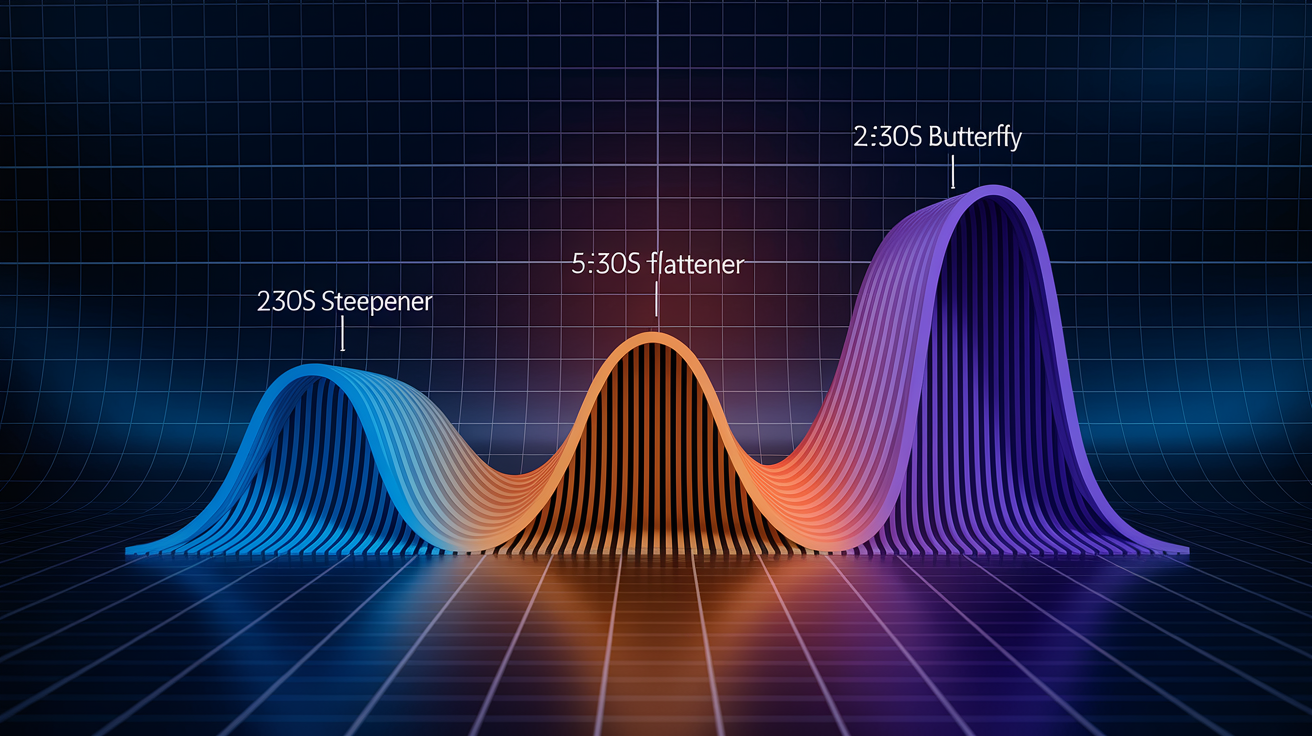
Curve steepeners and flatteners isolate slope exposure while neutralizing level risk. A 2s10s steepener (long 10-year duration, short 2-year duration in dollar-neutral amounts) profits when the slope widens, regardless of whether yields rise or fall in parallel. During recession onset, bull steepening often delivers steep 2s10s moves (50 to 100 basis points over a few months), making steepeners attractive when unemployment rises and the Fed signals cuts. In the 2020 to 2021 recovery, bear steepening occurred as the Fed held short rates at zero but markets priced inflation and fiscal stimulus, pushing long yields sharply higher. Steepeners captured that slope expansion even as absolute yields climbed. Steepeners carry negatively when the curve is inverted (you pay higher yield on the short leg and receive lower yield on the long leg), so timing entry around Fed pivots or macro inflection points matters.
Flatteners profit from slope compression. A 5s30s flattener (long 5-year duration, short 30-year duration) benefits when long yields rise less than intermediate yields or fall more, common during bear-flattening episodes where Fed hikes concentrate at the front end or during late-cycle inversions. Flatteners collected carry through much of 2022 and 2023 as the curve inverted deeply. The short 30-year leg earned high yield while the long 5-year leg cost less. Risk emerges if the curve un-inverts rapidly via bull steepening, erasing months of carry in days. Liquidity also varies. 2s10s trades are highly liquid in futures and swaps, while 5s30s or 10s30s can widen in bid-ask spread during volatility, adding slippage cost.
Curvature trades, implemented via butterflies, bet on how the belly moves relative to wings. A classic 2s5s10s butterfly (long 5-year duration, short equal dollar amounts of 2-year and 10-year duration) gains when the 5-year cheapens (yields rise) relative to a weighted average of 2s and 10s, or when the 5-year rallies more. Policy transitions often twist curvature. When the Fed pauses after hiking, the 2-year stabilizes, the 10-year rallies on growth fears, and the 5-year lags, creating negative butterfly. Liquidity distortions around auctions or quarter-ends can cheapen specific maturities, offering short-lived curvature opportunities. Term premium shifts also feed through unevenly. Fiscal supply usually lifts the long end more than the belly, flattening the 10s30s segment and steepening 5s10s, a pattern that shows up as positive butterfly in a 5s10s30s structure.
2s10s steepener: Long 10-year Treasury futures or swaps, short 2-year futures or swaps in duration-neutral ratio. Captures slope widening during Fed easing cycles or recession expectations.
5s30s flattener: Long 5-year duration, short 30-year duration. Profits from front-end-driven curve flattening or inversion. Positive carry when curve is inverted.
2s5s10s butterfly: Long 5-year, short 2-year and 10-year in equal duration-weighted amounts. Gains when belly underperforms wings or when policy transitions create curvature dislocations.
Duration Extension and Contraction Triggers Based on Historical Curve Regimes

In 2022, aggressive Fed rate hikes drove a textbook bear-flattening episode. The 2-year yield surged from around 0.75 percent in January to over 4.70 percent by October, while the 10-year moved from 1.50 percent to roughly 4.25 percent. The curve inverted sharply (2s10s reached negative 80 basis points), and portfolios that held long duration at the front end suffered immediate losses. Smart duration managers shortened aggregate duration by cutting 2 to 5-year exposure, preserving dry powder for eventual Fed pivots. Those who stayed long the belly or front end hoping for a quick reversal faced months of mark-to-market pain. The lesson: bear flattening driven by front-end repricing demands rapid duration contraction at short maturities, even if long-end yields seem anchored.
Tactical extension following inversion often delivers outsized returns. When an inverted yield curve steepens back toward zero or positive territory, recession risk crystallizes and the Fed pivots to cuts within months. The 2019 inversion unwound into 2020 as COVID hit and the Fed slashed rates to zero. Portfolios that extended duration at the front end in late 2019 captured large gains as 2-year yields collapsed 150 basis points in weeks. The current environment (10-year/2-year moving from negative 46 basis points in mid-June toward single-digit inversion) sets up a similar trade. Once the curve reaches zero or flips modestly positive, extending 2 to 5-year duration positions you for the next easing cycle, assuming macro weakness confirms the signal. Wait too long, and front-end yields gap lower before you act.
Taper shocks recalibrate duration risk budgets by revealing how sensitive long-end yields are to supply and liquidity signals. The 2013 “taper tantrum” saw 10-year yields spike from 1.60 percent in May to 3.00 percent by September after the Fed hinted at QE tapering. Duration positioned at the long end absorbed severe losses, and many investors cut back-end exposure permanently. That episode taught portfolios to monitor Fed balance-sheet policy as closely as the Funds rate. When the Fed shifts from buyer to seller (quantitative tightening), term premium rises and long duration becomes a funded bet on supply absorption. Today’s QT environment (the Fed is still shrinking its balance sheet) keeps term premium elevated, making tactical long-end extension a carry drain unless you have high conviction that growth will weaken enough to push long yields lower despite supply.
Strategic Duration Allocation and Business-Cycle Integration

Strategic duration allocation sets the long-horizon baseline, adjusting slowly as the business cycle evolves rather than chasing weekly data prints. Early in an expansion, growth accelerates, inflation risks build, and the Fed tightens or signals tightening. The optimal stance is shorter duration to limit losses as yields rise across the curve. Mid-cycle, growth moderates but stays positive, inflation stabilizes, and the Fed pauses. Duration can drift back toward neutral, capturing carry while awaiting the next inflection. Late cycle, growth slows, unemployment ticks higher, and the Fed contemplates cuts. Extending duration (particularly at the front and belly) positions for the eventual policy pivot. The magnitude of each shift depends on how sharply conditions change. A soft landing might justify modest extension, while hard-landing signals warrant aggressive moves into the 5 to 10-year sector.
Dynamic swap overlays offer a formal way to integrate carry opportunities and business-cycle signals into duration positioning. Research shows that multi-asset portfolios using swap overlays positioned strategically along the curve (adjusting both the maturity point and the amount of duration) achieve higher Sharpe ratios and smaller drawdowns than static long-Treasury hedges. The overlay sizes duration at each maturity by balancing two inputs: the roll-down/carry available at that point, and the current cycle stage’s historical correlation with that maturity’s performance. In late cycle, the 5-year point typically offers positive carry (if the curve is upward-sloping) and strong hedging power as the Fed nears cuts, so the overlay would overweight 5-year swaps. Early cycle, when the curve is flat or inverted and front-end yields are elevated, the overlay might hold minimal duration or concentrate it at the long end where term premium is high. These adjustments occur quarterly or semi-annually, avoiding the whipsaw of weekly tactical shifts while staying aligned with macro fundamentals. For more on carry-based business-cycle duration tilts, see Optimizing Yield Curve Positioning for Multi-Asset Portfolios.
Cycle-Based Duration Rules
Duration extension late cycle centers on the 2 to 7-year sector, where Fed rate-cut expectations drive the largest yield declines and roll-down remains positive if the curve steepens. Extend when leading indicators (ISM new orders, jobless claims, yield-curve inversion duration) signal recession within six to twelve months, even if the Fed hasn’t announced cuts yet. Extension can reach 1.0 to 2.0 years above benchmark duration, concentrated in the belly, to capture front-end rally while maintaining liquidity.
Duration contraction early cycle focuses on shortening aggregate duration and underweighting the long end, since growth reacceleration and inflation pressures push yields higher. Contract when PMI rebounds above 50, unemployment stops rising, and the Fed shifts to hawkish language. Cut duration 0.5 to 1.5 years below benchmark, favoring the 0 to 3-year sector where carry compensates for modest yield risk, and trim 10 to 30-year exposure where capital losses amplify. These rules act as a baseline. Overlay tactical adjustments when curve mispricings or policy surprises create short-term opportunities.
Using Derivatives to Implement Duration Adjustments Efficiently

Treasury futures provide the most liquid and capital-efficient tool for adding or removing duration at benchmark maturities. The 10-year note future (ticker ZN or TY) and 2-year note future (ZT) trade with tight bid-ask spreads, deep order books, and central clearing, making them ideal for tactical overlays. One 10-year contract delivers roughly 6 to 7 years of duration per $100,000 notional at current yield levels, so a modest number of contracts shifts portfolio duration meaningfully without liquidating cash bonds. Futures also embed repo financing at the general-collateral rate, lowering the cost of carry versus holding physical Treasuries on leverage. The downside: futures roll quarterly, creating small transaction costs and tax events, and basis risk (the spread between futures and cash bonds) can widen during stress, temporarily distorting your hedge. Still, for portfolios that need to move duration quickly or lack capital to buy bonds outright, futures are the first choice.
Interest-rate swaps offer precise maturity targeting and flexibility across the curve. A pay-fixed 5-year swap (where you pay a fixed rate and receive floating SOFR) adds 5-year duration to the portfolio synthetically, equivalent to owning a 5-year Treasury but without the upfront capital outlay. Swaps scale easily. Notional amounts adjust in $1 million increments, and you can ladder multiple swaps (2-year, 5-year, 10-year) to match your key rate duration targets exactly. Swap overlays shine in multi-asset portfolios because they separate duration management from security selection. You hold credit bonds or equities in the underlying portfolio and layer swap duration on top to hit your risk budget. Swap spreads (the difference between swap rates and Treasury yields) add a small spread risk. If swap spreads tighten, your pay-fixed position underperforms owning Treasuries directly, and vice versa. Monitor swap spreads when sizing overlays. Tightening spreads (common during flight-to-quality) can offset some duration gain.
Swap spreads themselves become a tactical tool when they diverge from fair value. Historically, 10-year swap spreads trade around 20 to 40 basis points positive (swaps yield more than Treasuries), reflecting credit and liquidity premia. When spreads compress toward zero or turn negative (2016 saw sustained negative 10-year swap spreads), receive-fixed swaps (short duration synthetically) become attractive relative to shorting Treasuries, because you earn the Treasury yield minus a smaller (or negative) spread. When spreads widen beyond historical norms, pay-fixed swaps are cheap relative to cash Treasuries, making them a better vehicle for adding duration. Tracking swap-spread mean reversion and correlation with dealer balance-sheet constraints gives you an edge in choosing between futures, swaps, and cash bonds for each duration adjustment.
| Instrument | Use Case |
|---|---|
| Treasury Futures | High liquidity and tight spreads for rapid duration shifts at 2-, 5-, 10-, and 30-year points; embedded financing; quarterly roll required. |
| Interest-Rate Swaps | Precise maturity targeting across the curve; scalable notional; separates duration from cash holdings; introduces swap-spread basis risk. |
| Swap Spreads | Exploit relative value between swaps and Treasuries; wide spreads favor pay-fixed swaps for duration, tight/negative spreads favor receive-fixed swaps or Treasury shorts. |
Portfolio Rebalancing, Monitoring Duration Drift, and Risk Controls

Duration drift occurs passively as bonds age, yields change, and convexity shifts. A portfolio with 5.0 modified duration today might drift to 4.7 or 5.3 within weeks if yields move sharply or holdings roll down the curve. Small duration deviations can significantly influence excess returns in benchmark-aware portfolios. A 0.5-year difference in duration during a 100-basis-point yield move translates to roughly 50 basis points of return difference. That’s why monitoring drift weekly or at minimum bi-weekly is standard practice. Use portfolio analytics to decompose total duration into contributions from each security, then compare current duration to your target band (for example, benchmark ±0.5 years). When drift pushes you outside the band, rebalance using the most cost-effective tool. If you’re short duration and near month-end, buy cash bonds rolling down favorably. If you’re over duration and facing a Fed announcement, sell futures to trim risk immediately.
VAR (value-at-risk) impact from duration changes feeds into enterprise risk limits. A 1-year increase in portfolio duration might raise one-day 95 percent VAR by 15 to 25 basis points of portfolio value, depending on yield volatility. Track how each duration adjustment shifts VAR and ensure the new level stays within board-approved risk appetite. If adding duration for a tactical call pushes VAR above the limit, either reduce position size or hedge with options (buying puts on Treasury futures caps downside while preserving upside if yields fall). Carry and roll-down changes also matter. Extending duration into a flat or inverted curve sacrifices carry, so calculate the breakeven horizon (how long yields must stay unchanged for capital loss to offset carry drag). If breakeven is six months but your macro view has conviction for only three months, size the position smaller or use a lower-cost instrument like a receiver swaption (option to enter a receive-fixed swap) that limits premium loss if the view doesn’t pan out.
Monitoring steps for duration oversight:
Drift tracking: Compare current modified duration and key rate durations to target. Flag deviations beyond ±0.3 years for benchmark portfolios, ±0.5 years for unconstrained mandates.
VAR impact: Recalculate portfolio VAR after each material duration change. Confirm new VAR falls within risk limits and aligns with return targets.
Carry and roll-down changes: Update monthly carry projections and roll-down capital gain estimates. Assess whether current duration positioning earns enough income to justify mark-to-market risk.
Curve regime checks: Review weekly whether the prevailing curve shift (steepening, flattening, level change) matches your duration bias. Adjust if regime diverges from forecast or if new macro data points shift probabilities.
Integrating Duration Positioning Across Multi-Asset Portfolios

Multi-asset portfolios gain diversification benefits when duration exposure is dynamic rather than static, because equity drawdowns and credit spread widening rarely move in lockstep with Treasury rallies. A static long-Treasury hedge (holding 30-year bonds as a permanent equity offset) underperforms in bear-steepening regimes where equities rally and long bonds sell off, delivering losses on both sides. Dynamic duration integration adjusts Treasury exposure by regime. In late cycle when equity vol rises and credit spreads widen, extend duration at the 5 to 10-year point to capture flight-to-quality. In early cycle when equities rally and spreads tighten, shorten duration to avoid capital losses and reallocate risk budget toward credit carry. This regime-aware approach lifts portfolio Sharpe ratios by 0.2 to 0.4 over static strategies, because duration hedges activate when correlations turn favorable and scale back when they don’t.
Hedging duration with options preserves convexity and limits tail risk when positioning for large curve moves. Buying receiver swaptions (options to enter receive-fixed swaps, gaining duration if exercised) costs upfront premium but allows you to participate in bull-steepening rallies without suffering losses if yields rise instead. If you expect the Fed to cut 150 basis points over the next year but want protection against a hawkish surprise, buy a 1-year receiver swaption struck at current 5-year swap rates. If the Fed cuts, you exercise and lock in duration at favorable levels, and if the Fed holds, you lose only the premium (typically 10 to 30 basis points of notional). Buying payer swaptions (short duration upon exercise) hedges against bear-steepening scenarios while keeping your cash portfolio intact. Options add explicit cost, so they suit high-conviction calls or tail-hedge strategies. For routine duration adjustments, futures and swaps remain cheaper.
Duration contribution attribution decomposes total portfolio return into components: carry (coupon income plus roll-down), duration return (capital gain or loss from yield changes), curve return (P&L from non-parallel shifts), and convexity return (gains from yield volatility when duration is long). Breaking out these sources clarifies whether your duration positioning delivered alpha or just captured beta. A portfolio that returned 6 percent last year might show 3 percent from carry, 2.5 percent from duration (yields fell 50 basis points, contributing to capital gains), 0.3 percent from a profitable steepener trade (curve return), and 0.2 percent from convexity as volatility spiked. If your duration target was neutral but you ended up +1.0 years overweight, and that overweight added 1.5 percent of return, you know the active duration call worked. If duration was overweight but subtracted return, you either mistimed the entry or misread the curve regime, and attribution highlights exactly where to adjust process.
Attribution of Duration to Portfolio-Level Risk
Decomposition starts by isolating carry. Calculate the sum of coupon income and theoretical roll-down gain (capital appreciation as bonds move down the curve toward maturity, assuming yields stay constant). Carry is the baseline return you’d earn in a no-change scenario. Next, compute duration return by multiplying portfolio modified duration by the actual change in benchmark yield (for example, if duration is 5.0 and the 10-year yield falls 40 basis points, duration return is roughly +2.0 percent). Separate out curve return by measuring P&L from steepeners, flatteners, or butterflies (any position where you’re long one maturity and short another). This isolates non-parallel shift alpha. Convexity contribution comes from the portfolio’s total convexity multiplied by the square of yield change and a scaling factor. Positive convexity adds return when yields move in either direction, while negative convexity (common in callable bonds or mortgage-backed securities) subtracts. Sum these four components and reconcile to total return. Any residual typically reflects security-specific spread changes or small model errors. Running this decomposition monthly or quarterly shows which duration levers (carry, level, curve, convexity) are driving results, letting you double down on what works and fix what doesn’t.
Final Words
In the action, we tied yield-curve regimes to concrete duration moves — when curves steepen or flatten, why short‑end versus long‑end risk matters, how key‑rate duration guides sizing, and which trades (steepeners, flatteners, butterflies, swaps/futures) implement those calls.
The takeaway: monitor forward rates, term premium, and key rate shifts; favor the 5‑year belly for efficient hedging; use derivatives for clean overlays.
Next steps: codify triggers, run small overlay tests, monitor drift and carry. Using yield curve shifts to inform duration positioning keeps you proactive and in control.
FAQ
Q: How should yield curve shifts map to duration extension or contraction?
A: The mapping of yield curve shifts to duration: extend duration on bull steepening or bull flattening (yields falling); contract duration on bear steepening or bear flattening (yields rising), focusing on the curve points moving most.
Q: How do parallel versus non-parallel shifts affect key rate duration decisions?
A: The effect of parallel versus non-parallel shifts is that parallel moves change across-the-board duration equally, while non-parallel shifts require key-rate duration adjustments targeting specific maturities and reweighting exposure.
Q: What macro signals should prompt duration changes?
A: Macro signals prompting duration changes include labor softening, a decelerating inflation path, dovish central-bank cues, weakening growth, and heavy fiscal issuance—each shifts forward-rate expectations and term premium differently.
Q: How can forward rates and term premium estimates reveal curve mispricing?
A: Forward rates and term premium estimates reveal mispricing by comparing market-implied forward paths to economic forecasts; a large term-premium move versus fundamentals signals potential tactical duration opportunities.
Q: What is key rate duration and why is the 5‑year point often a focus?
A: Key rate duration measures sensitivity at a specific maturity. The 5‑year often concentrates risk and provides strong hedging payoff per basis point, making it efficient for duration allocation.
Q: Which tactical trades suit steepening, flattening, and curvature expectations?
A: Tactical trades for shape views: a 2s10s steepener to profit from front-to-back moves, a 5s30s flattener to shorten long risk, and a butterfly to harvest curvature shifts while limiting outright duration exposure.
Q: When did duration shorten in 2022 and what triggered it?
A: Duration shortened in 2022 during bear flattening, driven by aggressive short-end rate hikes and repricing of policy—portfolio managers reduced long exposure to limit mark-to-market losses.
Q: What long‑horizon rules link duration to the business cycle?
A: Long-horizon rules tie duration to cycle: extend duration late cycle when growth slows and yields fall; contract early cycle when hikes start. Use carry-based swap overlays for smoother returns.
Q: Which derivatives are most efficient for implementing duration adjustments?
A: Derivatives for efficient adjustments: Treasury futures for quick, cost‑effective duration; interest-rate swaps for flexible synthetic duration; swap spreads to fine-tune hedges and manage basis risk.
Q: How should portfolios monitor duration drift and enforce risk controls?
A: Portfolios should monitor duration drift via regular checks, VAR impact, carry/roll changes, and curve-regime alarms; set rebalancing frequency and hard exposure limits to enforce controls.
Q: How do you integrate duration across multi‑asset portfolios and attribute its sources?
A: Integrating duration across multi-asset portfolios means dynamically tilting instead of static hedges; attribute duration alpha into carry, roll-down, curve shifts, and convexity to assess contribution and risk.